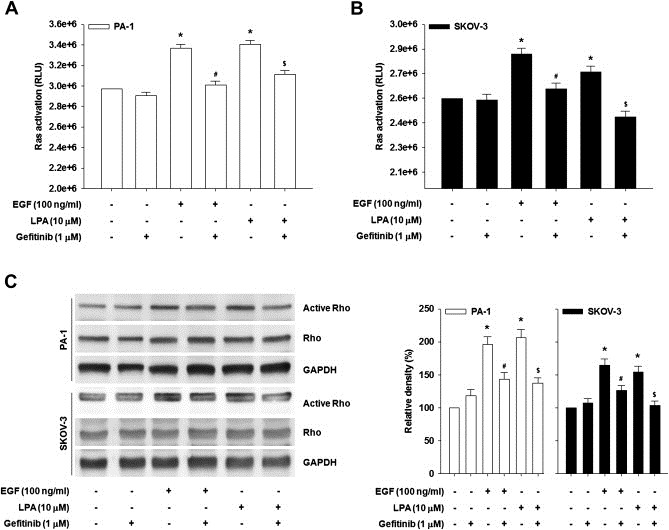
Figure 3.

EGFR activates Ras and Rho. The serum‐starved PA‐1 (A) and SKOV‐3 (B) cells were pretreated with gefitinib for 1 h and then stimulated with LPA or EGF for 3 min. Ras activity was analyzed by Ras activation assay kit (Error bars, ± s.d. ∗p < 0.01 vs control, #p < 0.05 vs EGF treatment only, $p < 0.05 vs LPA treatment only). All experiments were repeated three times. (C) The serum‐starved cells were pretreated with gefitinib for 1 h and then stimulated with LPA or EGF for 3 min. Rho activity was analyzed by Rho GTP pull‐down assay. Densitometric analysis is representative of three independent experiments. The histograms show the ratio between active and total Rho protein levels (Error bars, ± s.d. *p < 0.01 vs control, #p < 0.05 vs EGF treatment only, $p < 0.05 vs LPA treatment only).
