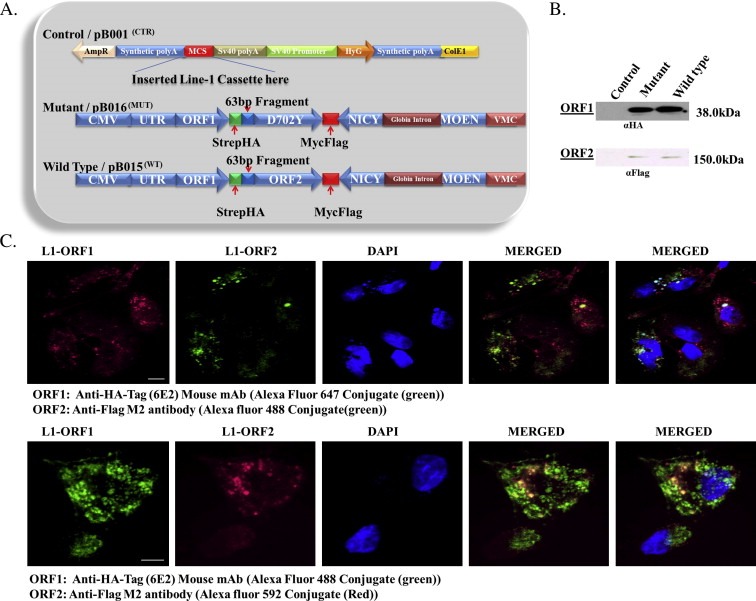
Figure 1.

Expression of synthetic L1 in HepG2 cells. (A) Schematic diagram of L1 vectors constructed to determine the influence of L1 on genetic targets in HepG2 cells. Control (pB001CTR) is the vector backbone, the L1 cassette was cloned into the multiple cloning site (MCS). Wild type (pB015WT) represents wild type L1 and mutant (pB016MUT) represents mutant L1. L1 ORF1 was tagged with Strep and HA tags (green), while ORF2 was tagged with Myc and Flag (red). Wild type and mutant both contain a neomycin cassette (blue) in the antisense orientation to assay for retrotransposition. (B) Western blot of ORF1 and ORF2 proteins with antibodies directed against HA and Flag, respectively. The 41 kDA and 151 kDA bands which are absent in control were detected by HA and Flag antibodies, respectively, indicating the expression of ORF1 and ORF2 proteins. All signals were obtained from the same membrane. (C) Indirect immunofluorescence of ORF1 (green, top panel; red, bottom panel) and ORF2 (red top panel; green, bottom panel) protein using conjugated HA (αHA tag (6E2) mouse‐Alexa‐488) and Flag tag (αFlag M2‐Alexa‐594) antibodies. Hoescht (blue) stains the nucleus with colocalization of the two proteins shown in yellow. Scale bar is 20 μm.
