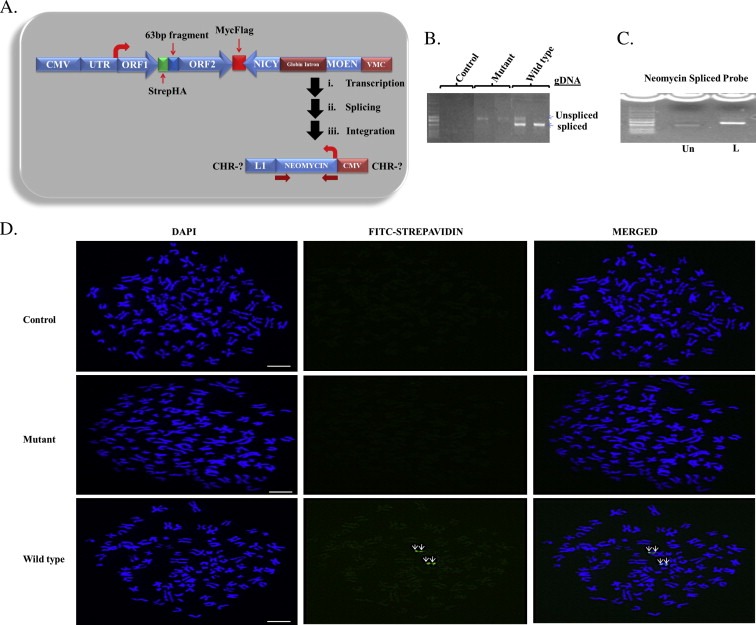
Figure 2.

Retrotransposition of stably expressed synthetic L1 in HepG2 cells. (A) Schematic diagram of the L1 vector containing the neomycin cassette. The thick arrows indicate splicing and integration of neomycin gene into the genome after ectopic expression of L1. (B) Spliced neomycin and un‐spliced neomycin gene from wild type cells and un‐spliced neomycin genes from mutant cells indicate the retrotransposition competency and incompetency respectively in these cells. No band is seen for cells expressing the control plasmid. (C) Degenerate Oligonucleotide Primed PCR (DOP‐PCR) product of neomycin gene from HepG2 genomic DNA. Result shows an increase in size of the biotin‐dTTP labeled (L) probe compared to the unlabeled probe (Un). (C) Fluorescence in situ hybridization (FISH) of synthetic L1 in HepG2 cell lines. The first column from left to right in C shows the 4′,6‐diamidino‐2‐phenylindole (DAPI) staining of chromosome spreads, the second column shows Streptavidin‐Fluorescein (FITC) staining of the neomycin probe and the third column shows the merged image of the two stains. Results show that only wild type L1 undergoes complete cycle of retrotransposition. Scale bar is 10 μm.
