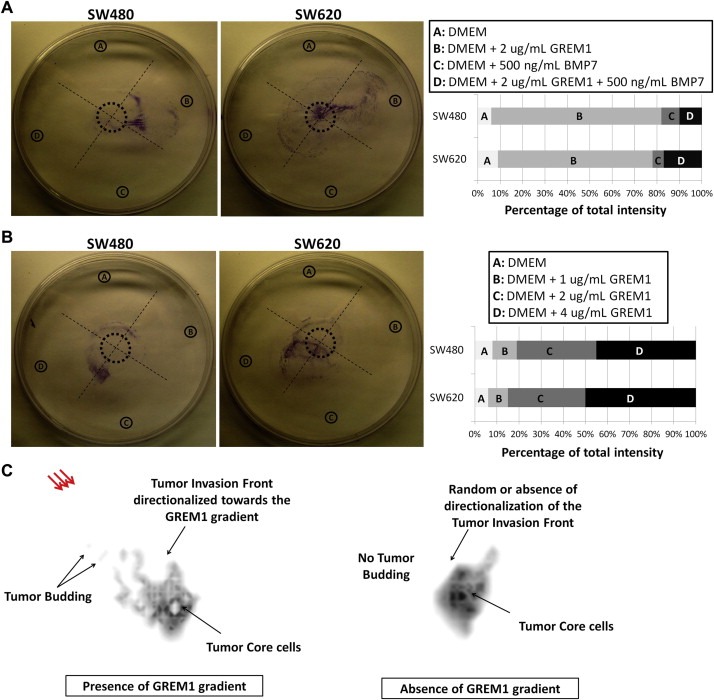
Figure 6.

GREM1 mediates the direction of migration of CRC cells in vitro and in silico. (A–B) under‐the‐agarose cell migration assays. Panels on the right describe in detail the gradients induced in each of the quadrants A–D. The corresponding graphs below describe the crystal violet intensity found in each individual quadrant, as percentage of the total fluorescence that was detected in the entire plate. The values are mean percentages of intensities from three independent replicates. The figures show one representative replicate from each cell line. (C) Magnified snapshot (generation #7080) of the mathematical modeling demonstrating the developing cancer cell cohort in either the absence of GREM1 gradient (right schematic) or the presence of it (red arrows; left schematic). The black arrows with labels and descriptions compare the behavior of the three prominent cancer cell subpopulations: Tumor core, tumor invasion front, and tumor budding cells.
