
Figure 3.
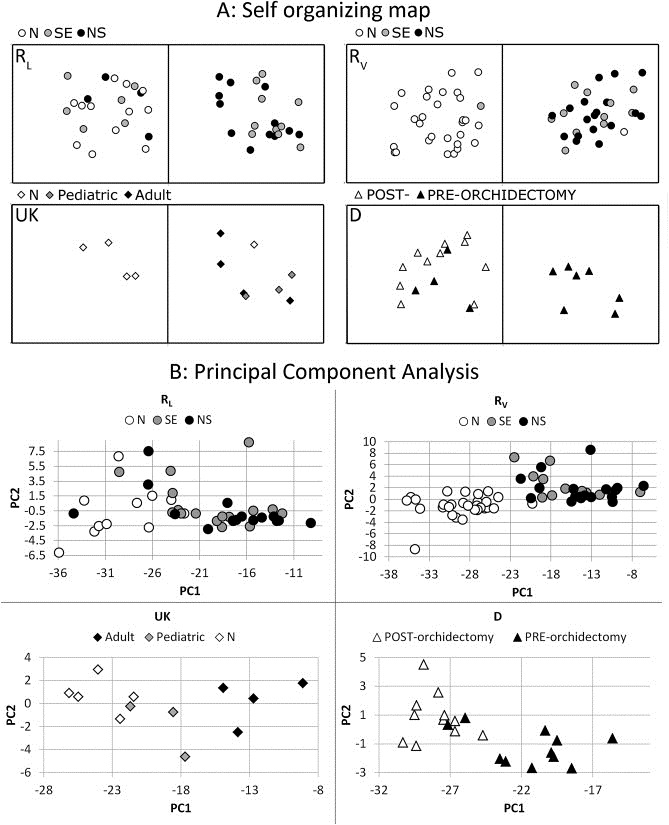
(A) A Kohonen Self‐Organizing‐Map (SOM) was generated using the RL series as training data. The SOM was set to identify two groups (alpha = 0.40, 500 iterations). Only miR‐371‐3/367 data were included because these showed the highest, most significant and most consistent difference between serum samples of patients with a GCC and controls. The generated SOM was then applied to the RV, D and UK series. RL: In the RL series, the right group only contained tumor samples, however the left group contained a mixed set of samples; RV: The same SOM identified a left group with almost only control samples (N) and one SE in the RV series. The right group contained all other tumor samples and one control sample; UK: The same SOM proved to also be able to separate all but one N samples from the T cases in the UK samples; D: All post‐orchidectomy samples from the D set clustered together, together with some pre‐orchidectomy samples. (B) Principal component analyses for all individual datasets. In all cases the first and second PC based on miR371‐3 explained > 99% of the variance. RL: although most of the tumor samples are clearly clustered and separated from the controls, there are some T (n = 7) intermixed with N; RV: All T and N samples cluster separately. One N (testicular torsion) is situated on the edge of the T/N border; UK: all N samples and T samples cluster separately. The pediatric YS are situated between the N samples and the adult GCC clusters; D: all but two pre‐orchidectomy samples cluster together. All post‐orchidectomy samples cluster together. This cluster also included two pre‐orchidectomy samples.