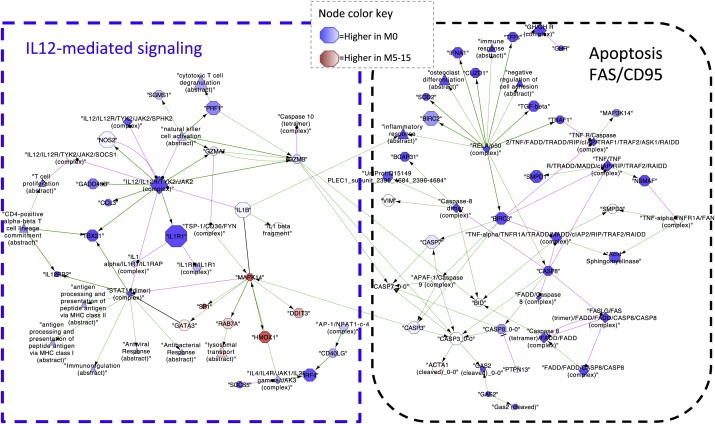
Figure 4.

IL12‐mediated signaling and FAS (CD95) apoptotic signaling network visualized using Cytoscape (Smoot et al., 2011). Each node of the network is a gene. Red nodes represent genes overexpressed in M5‐15 patients and blue nodes genes overexpressed in M0 patients; the color intensity correlates with the size of the expression.
