
Figure 4.
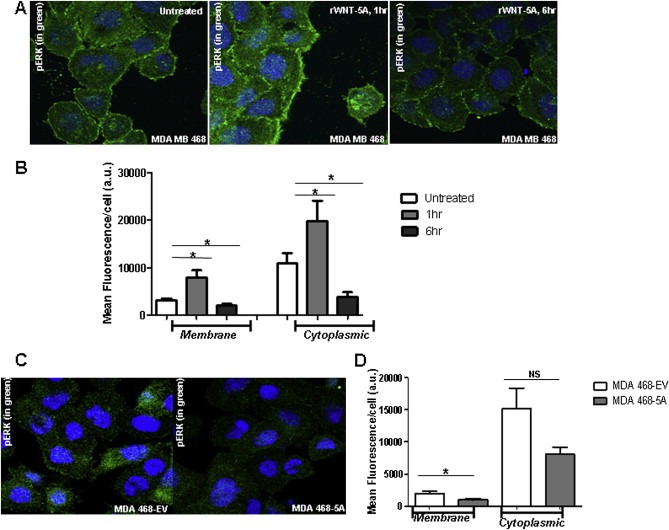
Immunofluorescence and Semi‐quantification of pERK1/2 staining. (A) Immunofluorescence staining of pERK1/2 in MDA‐MB468 cells not treated with rWNT‐5A or treated for 1 h or 6 h. For visualization, a secondary goat anti‐rabbit Alexa‐488 labeled antibody was used together with DAPI counterstaining. (B) Semi‐quantification of these pERK1/2 fluorescent stainings were performed as described in Materials and methods. For each experiment between 10 and 15 cells were evaluated per slide. Each experiment was performed in duplicate. (C) Immunofluorescence staining of pERK1/2 in MDA‐MB468‐EV and MDA‐MB468‐5A cells was visualized in same way as described in panel A. (D) Semi‐quantification of these pERK1/2 fluorescent stainings were performed in the same way as in panel B. Statistical comparisons between means were made with Student's t‐test (B and D). All error bars represent standard error of the mean (n = 3). *p < 0.05.