
Figure 1.
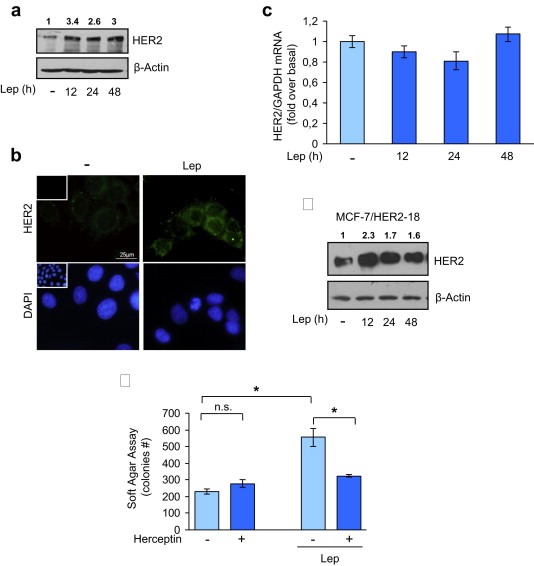
Leptin effects on HER2 expression. (a) MCF‐7 cells were untreated (−) or treated for 12, 24 and 48 h with leptin 500 ng/ml (Lep) before lysis. Equal amounts of total cellular extracts were analyzed for HER2 protein levels by immunoblotting analysis. β‐Actin was used as loading control. (b) Immunofluorescence of HER2 in MCF‐7 cells untreated (−) or treated with Lep for 24 h. Small squares, negative controls. 4′,6‐Diamidino‐2‐phenylindole (DAPI) staining was used to visualize the cell nucleus. Scale bar = 25 μm. (c) mRNA HER2 content, evaluated by real‐time RT‐PCR, after treatment with Lep as indicated. Each sample was normalized to its GAPDH mRNA content. The values represent the means ± s.d. of three different experiments each performed in triplicate. (d) Immunoblotting analysis of HER2 in total protein extracts from MCF‐7/HER2‐18 cells treated with Lep as indicated; β‐actin was used as loading control. (e) Soft‐agar growth assay in MCF‐7 cells treated with Lep in the presence or absence of herceptin (10 μg/ml). After 14 days of growth, colonies >50 μm diameter were counted. n.s., nonsignificant; *p < 0.05. Numbers on top of the blots represent the average fold change versus untreated cells normalized for β‐actin.