
Figure 7.
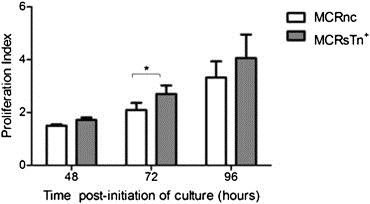
Comparison between the proliferation capacity of MCRnc and MCRSTn+ cells. The transduced MCR cells were labelled with CFSE and cultured for various periods of time (48, 72 and 96 h). The cells were harvested and analysed by flow cytometry with Modfit software, allowing the calculation of the proliferation index, which represents the average number of cells that was originated by a single cell of the parent generation. At the various periods of culture, MCRSTn+ cells show a higher proliferation index than the negative control, but this difference was only statistically significant at 72 h of culture. The data are presented as a mean ± standard deviation of 3 independent studies. “*” p < 0.05 (Student's T‐test).