
Figure 2.
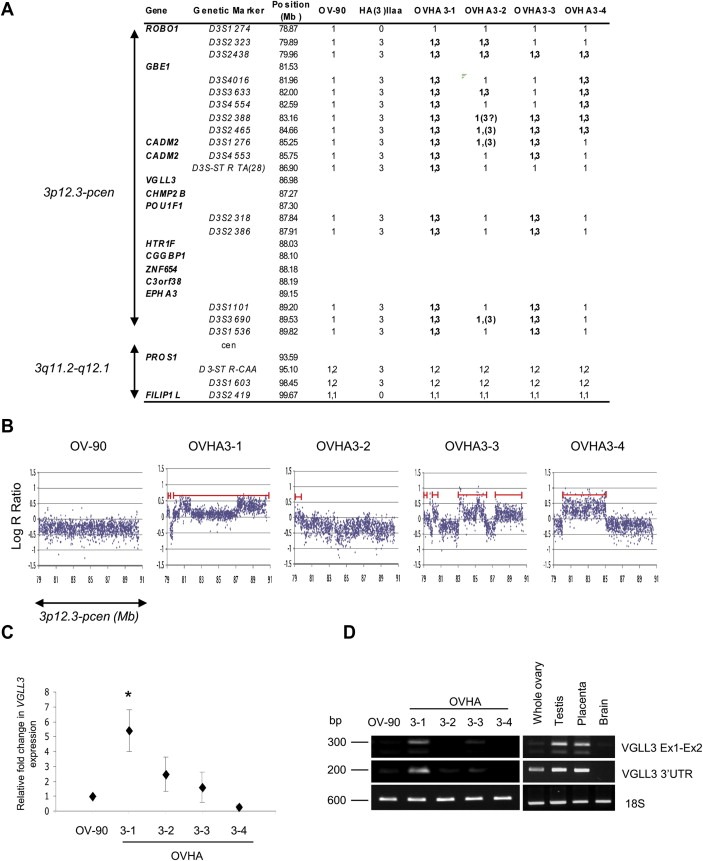
Genetic analyses of the 3p12‐q12 region in the MMCT hybrids. (A) Genotypes of the MMCT hybrids, parental OV‐90 cell line and HA(3)IIaa 3p12‐q12 donor cell line based on polymorphic microsatellite markers analyses. The data is aligned according to genomic position based on Human Genome Browser Gateway hg19 assembly where distance megabases (Mb) is relative to 3p‐telomere. Alleles (1,2) derived from the OV‐90 were distinguished from the HA(3)IIaa allele (3). Alleles exhibiting imbalance are in brackets. (B) Genotyping data from SNP BeadArray analyses of OV‐90 and the MMCT hybrids showing copy number (highlighted with red line) represented as Log R Ratio using the BeadStudio Data Analysis software of 3p12.3‐pcen interval aligned to chromosomal position (Mb, x‐axis). (C) Quantitative real time PCR analysis of VGLL3 in the MMCT hybrids (OVHA‐1, OVHA‐2 OVHA‐3, and OVHA‐4) normalized to expression values (±SE of four experiments performed in duplicate; significant differences (*p < 0.05) evaluated by t‐test) observed in OV‐90 parental cell line. (D) Semi‐quantitative RT‐PCR analysis of VGLL3 in OV‐90 and 4 MMCT (OVHA‐1, OVHA‐2 OVHA‐3, and OVHA‐4) hybrids using oligonucleotide primers that amplified either a portion of 3′UTR or message spanning exons 1 and 2 of VGLL3, where the expression of 18S is shown as a control for RNA quality. PCR products are shown relative to size markers (in basepairs (Bp)).