
Figure 4.
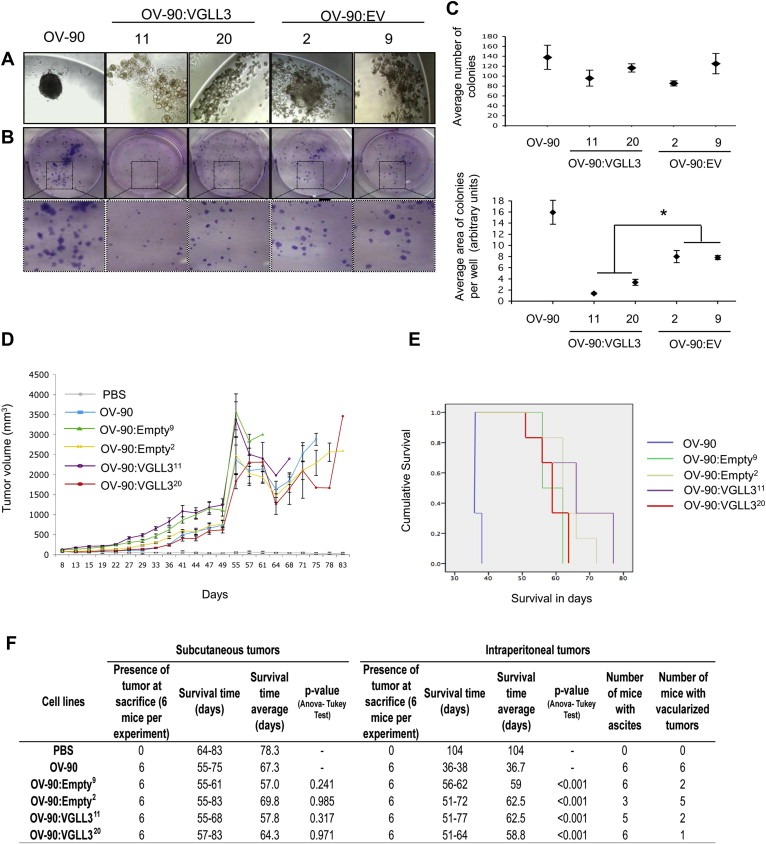
Characterization of the VGLL3‐stable clones. (A) Light microscopy images (×20) of cells in hanging drop cultures for spheroid formation assays of OV‐90, and the OV‐90:VGLL3 and OV‐90:EV stable clones. (B) Images of results from clonogenic assays (1× and 4×). (C) Average number of colonies (values represent the mean ± SE of number of colonies for each group in four experiments) and the total surface area of the colonies (values represent the mean ± SE of the total colony area per well for each group of three independent experiments) formed in clonogenic assays. (D) Tumor growth kinetics of OV‐90, OV‐90:VGLL311, OV‐90:VGLL320, OV‐90:EV2 and OV‐90:EV9 at subcutaneous injection (s.c.) site in mouse tumor xenograft assays. The mean of tumor sizes ± SE is reported on the graph for each group. Mann–Withney U‐test indicates no significant difference in the tumor growth kinetics. (E) Kaplan‐Maier survival curves of OV‐90, OV‐90:VGLL311, OV‐90:VGLL320, OV‐90:EV2 and OV‐90:EV9 at i.p. injection site. A post hoc Tukey test indicated a significant difference with a p‐value <0.001 in the survival time between OV‐90 and each of OV‐90:VGLL311, OV‐90:VGLL320, OV‐90:EV2 and OV‐90:EV9 at i.p. injection sites, but no significant difference between OV‐90:VGLL311 and OV‐90:VGLL320 with OV‐90:EV2 and OV‐90:EV9. Information related to survival time range and average of mice, the presence of tumors, ascites and evidence of vascularization are reported (F).