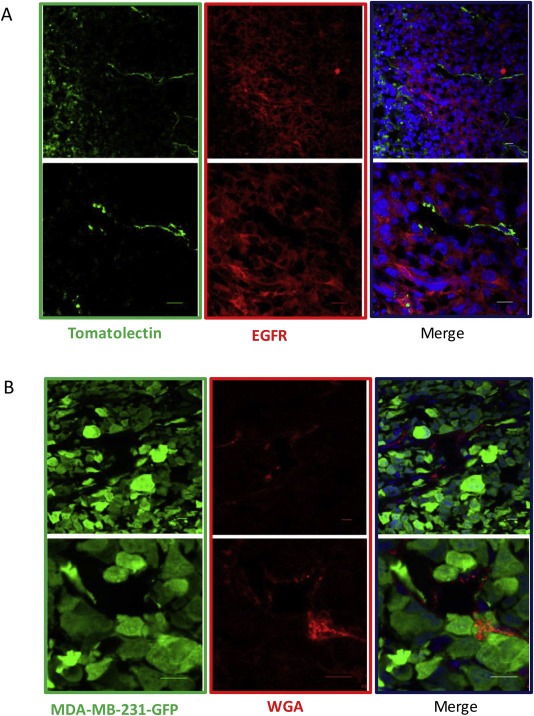
Figure 2.

In vivo VM by confocal analysis. Images represent single frames of frozen tumor sections of tomato lectin‐injected MDA‐MB‐231 xenograft mice and show an example of channel‐like structures (green) delimited by tumor cells labeled with EGFR (red). Nuclei were stained with DRAQ‐5 (blue). Scale bars represent 10 μm (A). Images represent single frames of tumors deriving from MDA‐MB‐231‐GFP xenograft mice injected with Alexa Fluor 555 WGA and show blood lacunae (red) surrounded by GFP positive tumor cells (green). Nuclei were stained with DRAQ‐5 Scale bars represent 10 μm (B).
