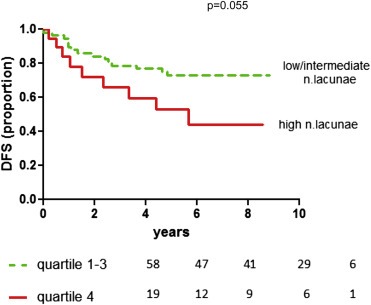
Figure 4.

Kaplan‐Meyer curve reporting DFS of 77 TNBCs divided in two groups (one represented by the quartile characterized by the highest number of lacunae, the other group including all 3 other quartiles, which show a similar curve trend).

Kaplan‐Meyer curve reporting DFS of 77 TNBCs divided in two groups (one represented by the quartile characterized by the highest number of lacunae, the other group including all 3 other quartiles, which show a similar curve trend).