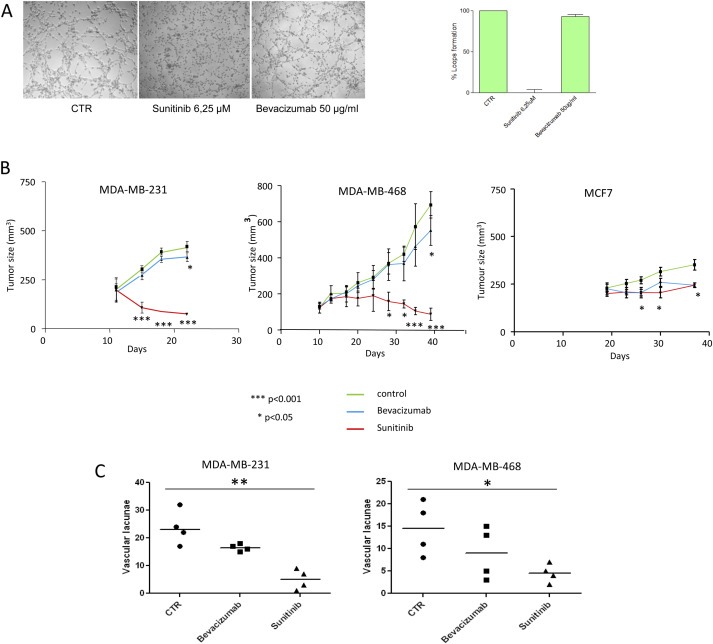
Figure 5.

In vitro and in vivo effect of Sunitinib and Bevacizumab and quantification of “blood lacunae”. Cells were seeded in 96‐well tissue culture plates pre‐coated with Matrigel and treated with Bevacizumab or Sunitinib (A); the assay was quantified as percentage of loops formation compared to untreated cells (right panel). Each value represents the mean ± s.d. of data from three separate experiments. 5 × 10⁶ TN MDA‐MB‐231, MDA‐MB‐468 or luminal MCF‐7 cells were injected into mammary fat pad of SCID mice, and when tumors reached a volume of 150 mm3, mice were treated or not with Sunitinib (per os, 40 mg/kg/day for 14 days) or Bevacizumab (i.p., 4 mg/kg twice at week for 4 weeks). Xenograft tumors derived from MDA‐MB‐231 and MDA‐MB‐468 cells showed highly significant responsiveness (***p < 0.001) to Sunitinib in comparison with MCF‐7 xenografts (*p < 0.05). Treatment with Bevacizumab caused comparable effects in terms of tumor volume reduction in MDA‐MB‐231, MDA‐MB‐468 and in MCF7‐derived xenograft mice. Error bars represent SD of 7 mice per group (B). Quantification of the absolute number of vascular structures lined by neoplastic cells out of 5 high‐power fields in sections from untreated, Sunitinib‐ or Bevacizumab‐treated MDA‐MB‐231 (left Scattered dot plot) or MDA‐MB‐468 (right Scattered dot plot) (*p = 0.0202, ***p = 0.0020) evaluated in four different mice (line at median value) (C).
