
Figure 1.
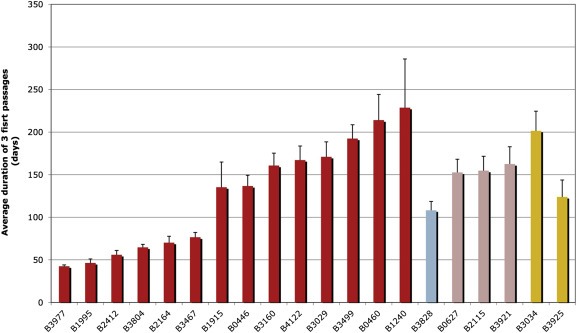
Growth kinetics of established breast PDXs. The average duration of the 3 first passage was calculated for each PDX and used as an estimate of their growth rate. Time is presented in days. Each bar represents a PDX. Color of the bar indicates the molecular subtype to which the PDX was assigned. As shown in Figure 2 red = Bas‐L, light blue = Lum‐B, pink = Lum‐C, orange = m‐Apo.