
Figure 4.
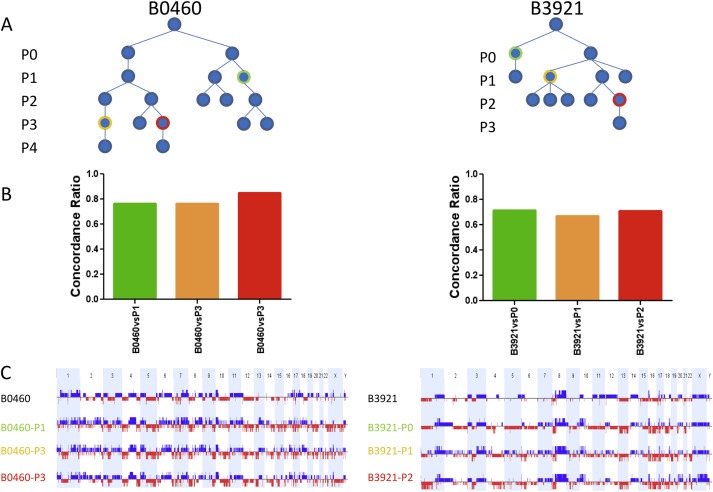
CNC profiles of different grafts from the same primary tumor remain remarkably stable .A: Graft tree indicating the position of the analyzed PDXs which have been highlighted by a color code. B: Histograms showing the fraction of overlapping events in the tumor of origin and the corresponding PDX which are identified by color codes indicated in the graft tree. C: whole genome CNC profiles, gains are shown in blue, losses in red, chromosomes by alternating light blue and white bars. Samples are identified as shown in the tree.