
Figure 1.
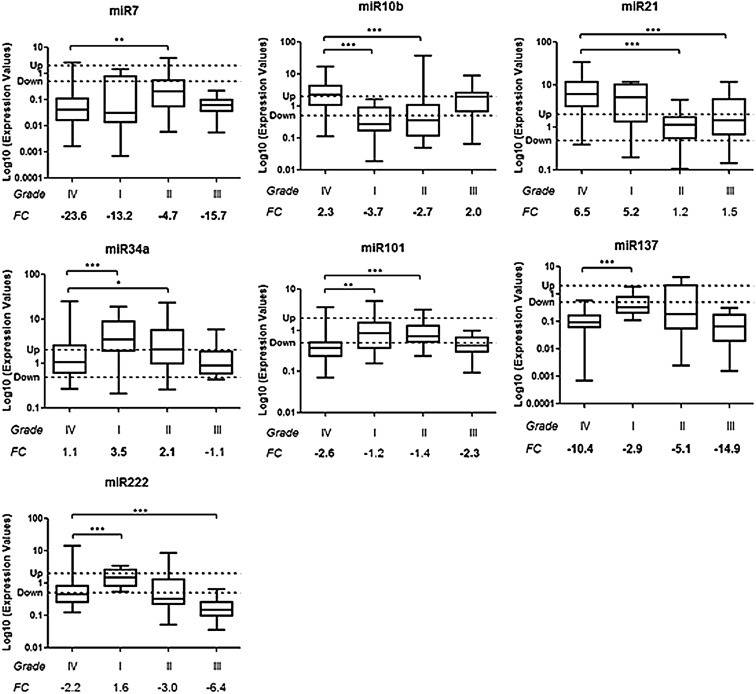
Differences in miRNA expressions among the 4 different‐grade tumor groups evaluated using the Ambion commercial reference as control. Box plots show microRNAs different between GBM Group (grade IV) and the other 3 tumor groups. Y‐axis indicates the microRNA Log10 expression level: “Up” and “Down” lines highlight the cut‐off of 2 fold change used to consider a microRNA as deregulated. In bold the up‐ or down‐regulated median FC values. Bars mean minimum and maximum values of miRNAs. ∗p < 0.05, ∗∗p < 0.01, ∗∗∗p < 0.001 according to Mann–Whitney test. FC: median Fold Change.