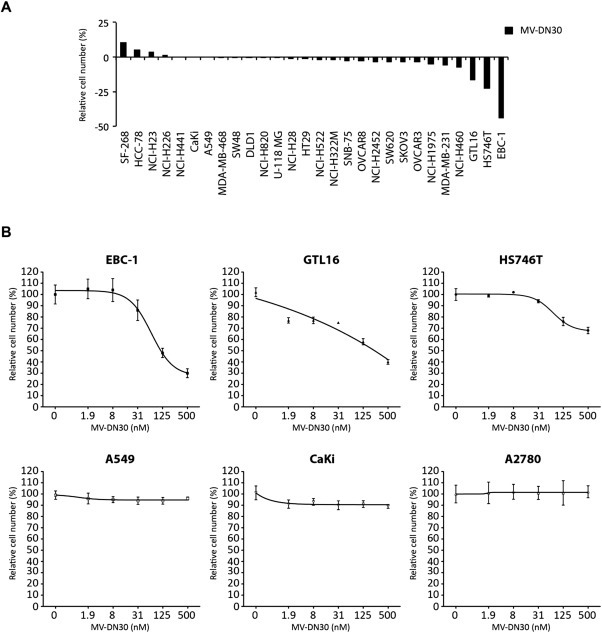
Figure 1.

Effect of anti MET MV‐DN30 treatment on cancer cell growth. (A) Waterfall plot showing the effect of MV‐DN30 on cell growth in a panel of 28 human cancer‐derived cell lines. Each cell line was grown in the presence of MV‐DN30 (125 nM) or placebo as adherent cells. Cell growth was measured 48 h after treatment start and measured by ATP cellular content (a proxy for cell numbers). Growth rates are expressed as percentage over placebo‐treated cells. (B) Dose‐response curves performed using increasing concentrations of MV‐DN30 (1.9–500 nM) on MET addicted cells: EBC‐1, GTL16 and HS746T; and on control cells: A549 (expressing physiological levels of MET), CaKi (expressing constitutively active receptor without it being amplificated – not addicted) and A2780 (not expressing MET). Data are means ± SD of three independent experiments performed in triplicates (A) and quadruplicated (B). Error bars represent standard deviations.
