Figure 5.

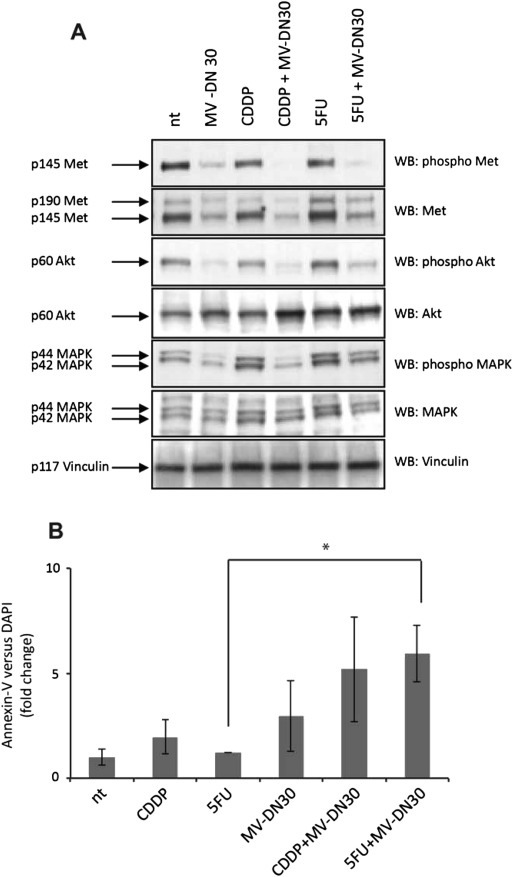
Analysis of MET signaling and apoptosis rates in response to MET inhibition alone or in combination with standard chemotherapy. (A) ECB‐1 cells were treated with MV‐DN30 (125 nM) alone or in combination with either CDDP (10 μM) or 5FU (10 μM) for 48 h. Cellular extracts were run on SDS PAGE gels and analyzed by western blotting using anti phospho MET and then reprobed with anti MET antibodies. MET signaling cascade was analysed probing the membranes with anti phospho MAPK and anti phospho AKT antibodies. Total MAPK and AKT levels were determined reprobing the same membranes. Vinculin was used as control for equal loading. (B) ECB‐1 cells were treated with MV‐DN30 (125 nM) alone or in combination with either CDDP (10 μM) or 5FU (10 μM) and apoptosis determined by flow cytometry analysis of Annexin V versus DAPI following 48 h of treatment. Data are means ± SD of three independent experiments. Error bars represent standard deviations. *: P < 0.05 by Student's t test.
