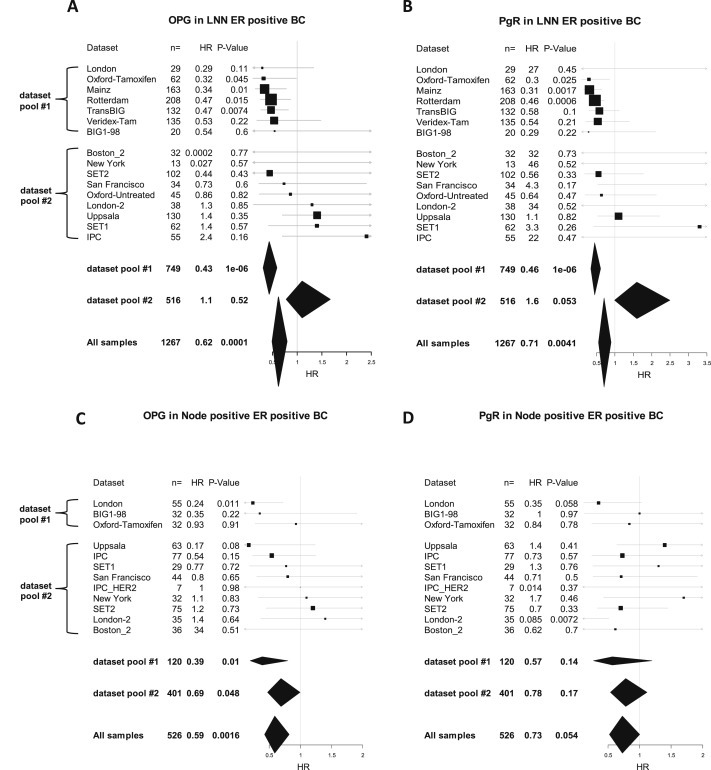
Figure 4.

Prognostic value of OPG and PgR expression in different dataset stratified according to lymph node status. Forest plot illustration of the results from univariate Cox regression analysis of survival according to OPG (A) and PgR (B) gene expression in lymph node negative (LNN) ER positive patients from individual datasets. The results for node positive patients are presented in panels (C) and (D) for OPG and PgR, respectively. Datasets are sorted according to the hazard ration of OPG within the two dataset pools in all four figures. Cutoffs for OPG and PgR were derived from their bimodal distribution. Size of squares relate to sample size, horizontal lines to 95% CI. Diamonds give summary measures of two dataset pools (#1 and #2) as well as all samples. The detailed results from the Cox regression analyses are given in Supplementary Table S9.
