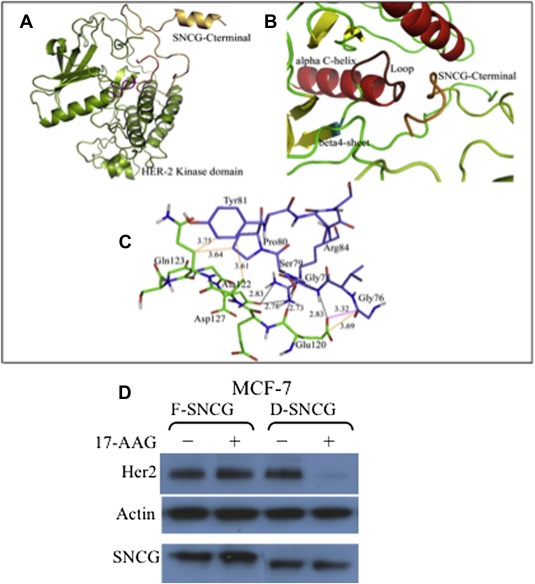
Figure 4.

Structure analyses of the interaction between SNCG and HER2. A. Docked interacting conformation of HER2 (color code: lemon green) with the SNCG‐C terminal region (color code: orange). B. The interaction mode between the residues Glu120‐Asp127 of SNCG with the loop connecting the αC helix with β4 sheet in the N‐lobe of the predicted HER2 kinase domain. C. Residues involved in the specific HER2 (violet colored stick)‐SNCG (green colored stick) interaction. Hydrogen bonds: black dotted lines. Hydrophobic interactions: orange dotted lines. Carbonyl–carbonyl interactions: magenta dotted lines. D. MCF‐7 cells, engineered to express full length F‐SNCG and C‐terminal deleted D‐SNCG, were treated with 17‐AAG (1 μM, 15 h) and extracts were subjected to Western analysis of Her2, SNCG, and actin.
