
Figure 7.
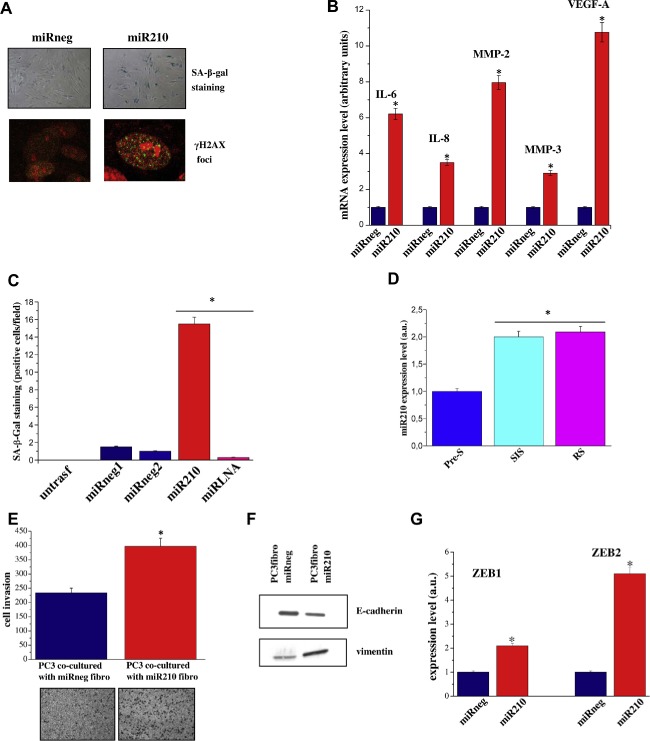
miR‐210 overexpression induces cellular senescence: stimulation of PCa invasiveness, metabolic reprogramming an in vitro angiogenesis. A) HPFs were transfected with miR‐210 or miRneg. After 1 week cells were stained for SA‐β‐Gal, or fixed and examined by immunofluorescence for H2AX phosphorylated on Ser139 (γ‐H2AX) and counterstained with propidium iodide. B) Total RNA was extracted from cells treated as in A) and IL‐6, IL‐8, MMP‐2 MMP‐3, and VEGF‐A mRNA expression level were analyzed by qRT‐PCR. Results are representative of three experiments with similar results. *p < 0.005 miR‐210 transfected HPFs vs miRneg transfected fibroblasts C) HPFs were transfected with miR‐210, miRneg1, miRneg2. After 48 h miR‐LNA inhibitor was ectopically overexpressed in miR‐210 transfected HPF. After 1 week cells were stained for SA‐β‐Gal. The bar graphs represent the mean of SA‐β‐Gal positive cells in six randomly chosen fields of triplicate experiments. *p < 0.005 miR‐210 and miR‐LNA inhibitor transfected HPFs vs miRneg transfected HPFs. D) qRT‐PCR measurement of miR‐210 expression levels in pre‐senescent or senescent fibroblasts. *p < 0.005 senescent cells vs pre‐senescent cells. E) HPFs were transfected with miR‐210 or miRneg. After 72 h PC3 cells were added to fibroblasts and co‐cultured for further 72 h. Cells were then separated and 8 × 10⁴ PC3 cells were subjected to invasion assay using a Boyden chamber. Invading cells were counted, and a bar graph, representative of six randomly chosen fields, is shown. *p < 0.005 PC3 cells transfected with miR‐210 cells vs PC3 cells transfected with miRneg. Cells treated as described, and (F) total cell lysates were subject to immunoblot to evaluate E‐cadherin and vimentin or (G) used for total RNA extraction and quantification of ZEB1 and ZEB2 mRNA expression level by qRT‐PCR. The results are representative of three experiments with similar results. *p < 0.005 miR‐210 transfected HPFs vs miRneg transfected HPFs. H–I) HPFs were transfected with miR‐210 or miRneg. After 72 h cells were serum starved for 24 h and then Lactate assay and ketone bodies assay were performed. *p < 0.005 miR‐210 transfected HPFs vs miRneg transfected HPFs. L) EPC cells, after 24 h of serum starvation, were seeded into the upper compartment of Boyden chamber. Cells were allowed to migrate through the filter toward the lower compartment filled with CM of HPFs transfected with miR‐210 or miRneg. *p < 0.005 miR‐210 transfected HPFs vs miRneg transfected fibroblasts. M) HUVECs were seeded on Matrigel coated plate in presence of CM of HPFs transfected with miR‐210 or miRneg. Cord formation was examined by phase‐contrast microscopy. The total number of junctions for optical field is counted. Results are representative of three independent experiments. *p < 0.005 miR‐210 transfected HPFs vs miRneg transfected fibroblasts.