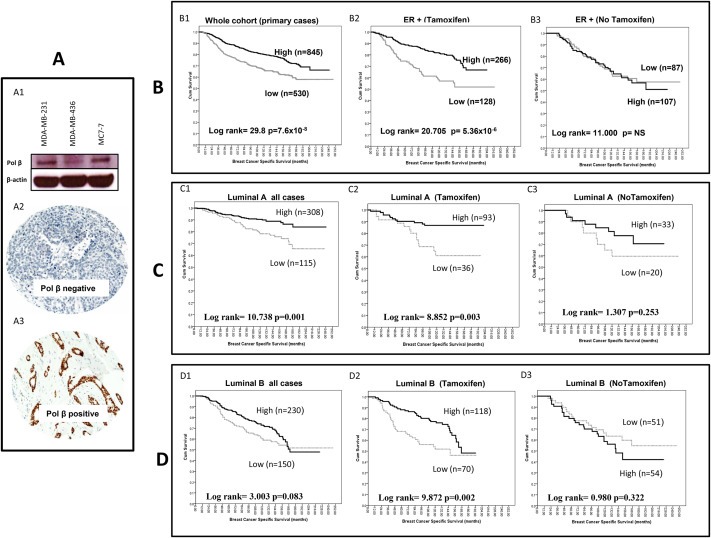
Figure 2.

Pol β protein expression in breast cancer. A. Western blot showing pol β in breast cancer cell lines (A1). Microphotographs of Pol β protein expression in breast cancer tissue (magnification × 200) showing tumour with low pol β expression (A2) and high pol β expression (A3). B. Kaplan Meier curves showing breast cancer specific survival in whole cohort (B1), ER + treated with tamoxifen (B2), ER + no tamoxifen (B3). C. Kaplan Meier curves showing breast cancer specific survival in luminal A sub‐group whole cohort (C1), luminal A treated with tamoxifen (C2), luminal A no tamoxifen (C3). D. Kaplan Meier curves showing breast cancer specific survival in luminal B sub‐group whole cohort (D1), luminal A treated with tamoxifen (D2), luminal A no tamoxifen (D3).
