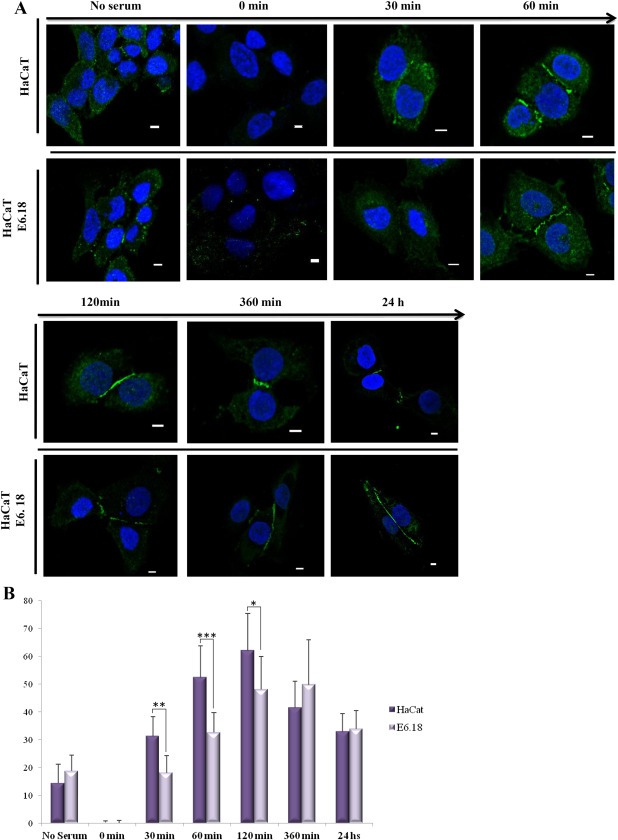
Figure 6.

High‐risk HPV E6 compromises tight junction formation during calcium switch assays. A) HaCaT mock‐transfected cells or stable HA‐E6.18‐expressing cells were subjected to a calcium switch assay and stained for ZO‐1 (green) at various times after return to complete medium. Nuclear DAPI staining (blue) is also shown. Scale bar: 5 μm. B) ZO‐1 levels at cell junctions were normalised with respect to cytoplasmic expression using the MacBiophotonics ImageJ 1.43 m software (Wayne Rasband, National Institutes of Health, USA). Normalised quantification of ZO‐1 border localisation in control (dark bars) and HaCaT E6.18 (light bars) cells after re‐addition of calcium at the indicated time points is represented. Values are mean data ±standard deviation of randomly selected fields from imaging slides from at least three independent experiments. Asterisks denote significant difference among E6.18 and control cells (*p < 0.05, **p < 0.01, ***p < 0.001).
