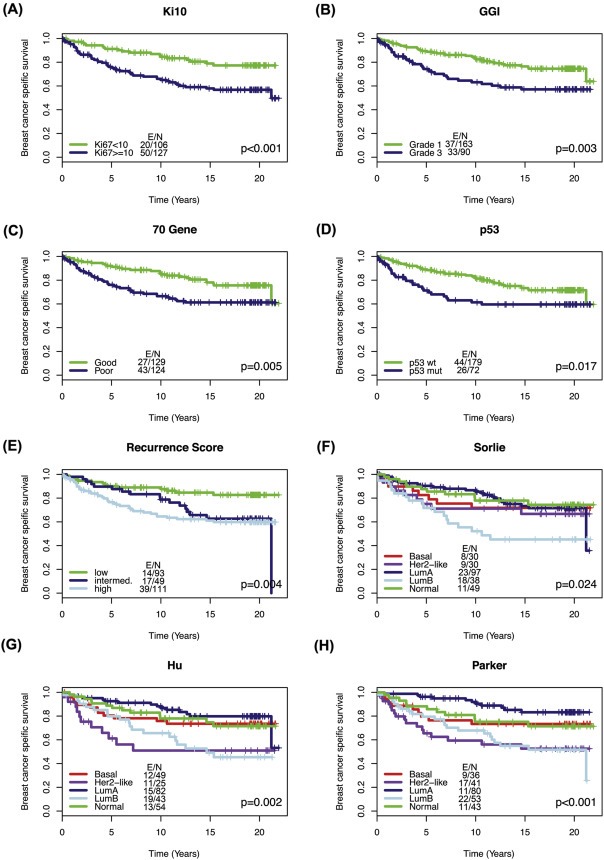
Figure 1.

Kaplan–Meier analysis of Ki67 and gene expression signatures in the Uppsala dataset Tumors in the Uppsala cohort were classified according to Ki67 expression below or above/equal to 10% and gene expression signatures. This classification and patient data were subsequently used to produce the following Kaplan–Meier curves (A) Ki67, 10% cutoff (B) GGI (C) 70‐gene (D) p53 (E) Recurrence score (F) Sorlie (G) Hu (H) Parker. P‐value is based on log‐ranked test, E/N = Number of events/number of patients.
