
Figure 2.
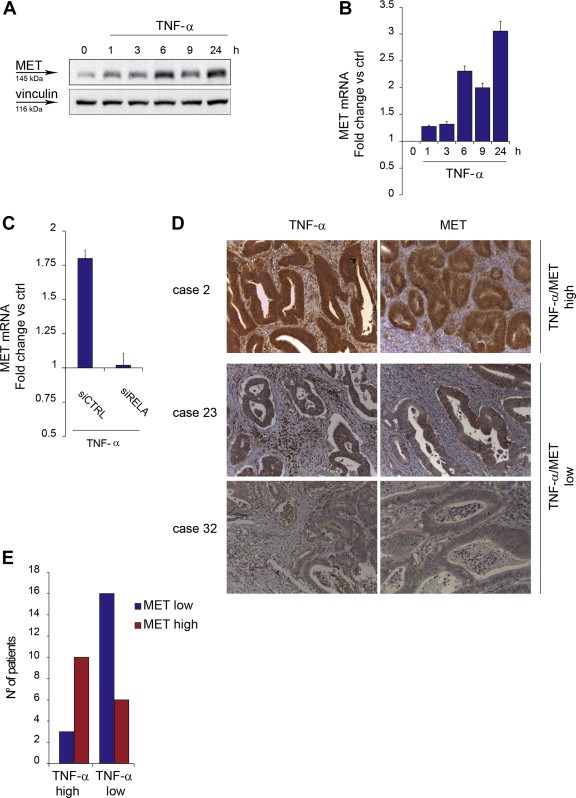
MET expression is induced by TNF‐α via NF‐κB and associates with TNF‐α in colorectal cancer. (A) Western blot showing MET protein in A549 cells at the indicated time‐points after TNF‐α treatment (10 ng/ml). Vinculin was probed as control of equal protein loading. (B) q‐RT PCR showing MET mRNA induction in A549 cells at the indicated time‐points after TNF‐α treatment (10 ng/ml). Data were normalized vs. PGK. Untreated cells were used as calibrator. Bars: mean of triplicate samples ± S.E.M of a representative experiment. (C) q‐RT PCR showing MET mRNA induction in A549 cells transfected 48 h before with siRNA against RELA (siRELA) or control siRNA (siCTRL), and treated with TNF‐α (10 ng/ml) for 6 h. Data were normalized vs. PGK. siRNA‐transfected, untreated cells were used as calibrator. Bars: mean of triplicate samples ± S.E.M of a representative experiment. (D) IHC analysis: sections of paraffin‐embedded human colorectal adenocarcinomas from representative cases stained with anti‐TNF‐α antibodies or anti‐MET antibodies. Case 2, TNF‐α/MET high: staining score 3+ for both; case 23, TNF‐α/MET low: staining score 2+ for both; case 32, staining score 2+ TNF‐α, 1+ MET. (E) Graph representing the number of patients that express high or low levels of TNF‐α in association with high or low levels of MET in their colorectal cancer sections, stained as in D. As detailed in Supplementary Table 1, TNF‐α high: staining score 3+ (13 cases); TNF‐α low: staining score 1+ and score 2+ (22 cases); MET high: staining score 3+ (16 cases); MET low: staining score 1+ or +2 (19 cases).