
Figure 2.
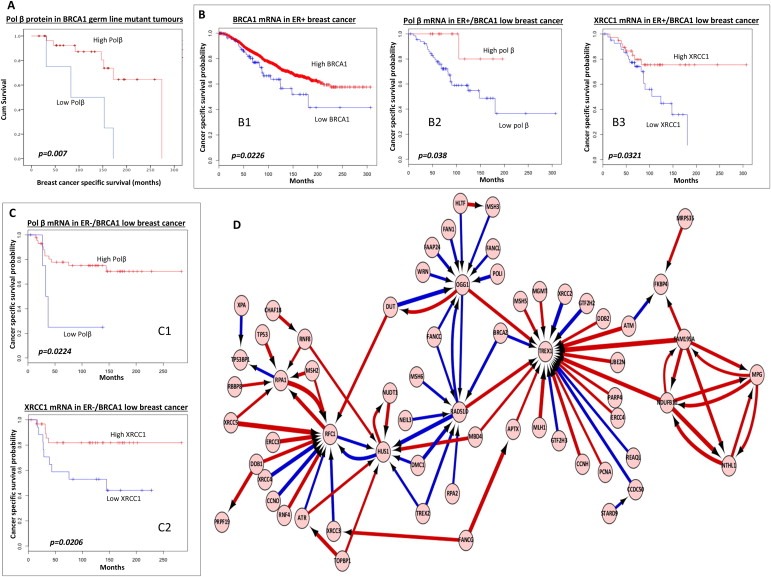
A. Kaplan–Meier curves showing overall survival in patients with germ‐line BRCA1mutated tumours based on pol β protein expression status. B1. Kaplan–Meier curves showing breast cancer specific survival (BCSS) in patients based on BRCA1 mRNA expression status in ER+ breast cancer (METABRIC cohort). B2. Kaplan–Meier curves showing breast cancer specific survival (BCSS) in patients with BRCA1 mRNA low/ER+ who received adjuvant endocrine therapy based on pol β mRNA status (METABRIC cohort). B3. Kaplan–Meier curves showing breast cancer specific survival (BCSS) in patients with BRCA1 mRNA low/ER+ who received adjuvant endocrine therapy based on XRCC1 mRNA status (METABRIC cohort). C1. Kaplan–Meier curves showing breast cancer specific survival (BCSS) in patients with BRCA1 mRNA low/ER‐who received adjuvant chemotherapy based on pol β mRNA status (METABRIC cohort). C2. Kaplan–Meier curves showing breast cancer specific survival (BCSS) in patients with BRCA1 mRNA low/ER‐who received adjuvant chemotherapy based on XRCC1 mRNA status (METABRIC cohort). D. The neural network illustrates the top genes that interact with BRCA1 and other DNA repair genes. In addition, the artificial neural network also reveals how these top genes interact with each other. Top pair‐wise interactions for gene probe markers associated with BRCA1 expression and the DNA repair process in 249 breast cancers is shown here. Each gene probe is represented by a node and the interaction weight between them as an edge, the width being defined by the magnitude of the weight. Interactions are directed from a source gene to a target gene as indicated by arrows. Red interactions indicate an excitatory interaction and blue indicates an inhibitory interaction. Highly linked genes represent hubs that are indicated to be highly influential or highly regulated in the BRCA1‐DNA repair system. See supplementary data S12 for the biological functions of individual genes.