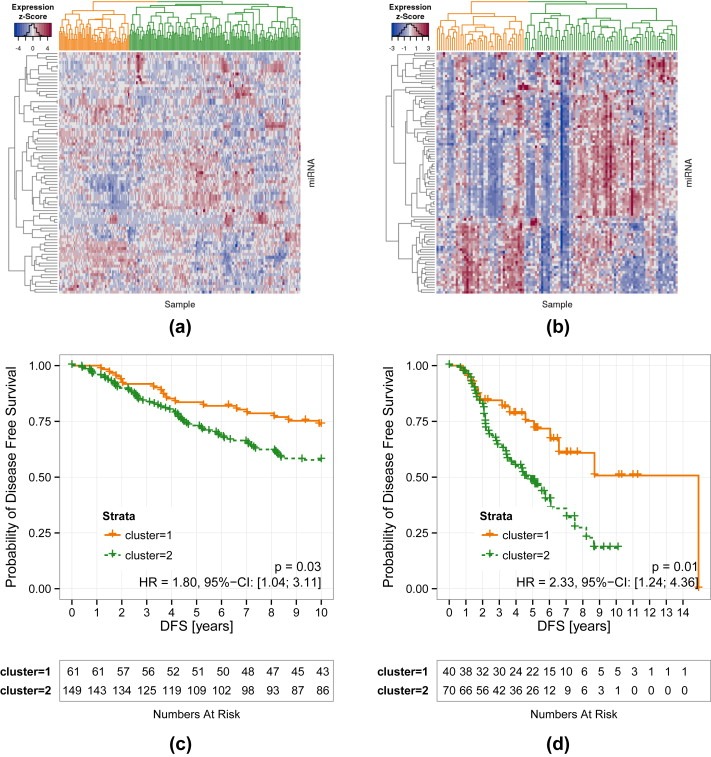
Figure 3.

Supervised clustering according to miR‐iTEM distinguishes DFS. Heatmap of the two separate clusters (given in orange and green in both datasets) based on the miRNA expression values of the miR‐iTEM list in the (a) Oxford and (b) Odense breast cancer datasets. Corresponding Kaplan–Meier graphs of DFS are depicted in (c) and (d), p‐values were determined by log rank test.
