
Figure 5.
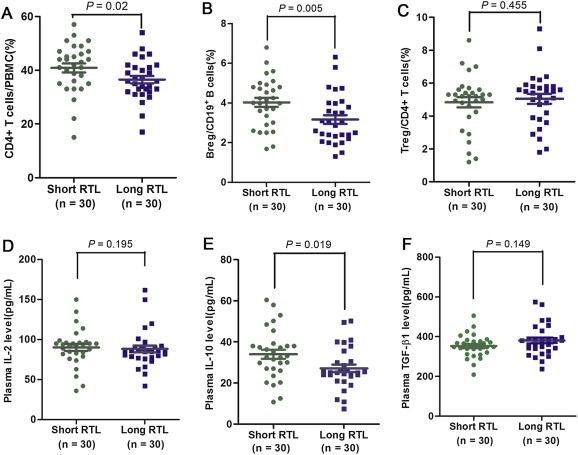
Immune phenotype and plasma cytokine concentrations in gastric cancer patients. (A–C) Flow cytometry detection of the percentage of CD4+ cells in PBMCs, CD19+IL‐10+ Bregs in B cells and CD4+CD25+FOXP3+ Tregs in CD4+ T cells of gastric cancer patients with long and short RTL (both n = 30). (D–F) Plasma concentrations of IL‐2, IL‐10 and TGF‐β1 were measured by ELISA in gastric cancer patients with long and short RTL (both n = 30).