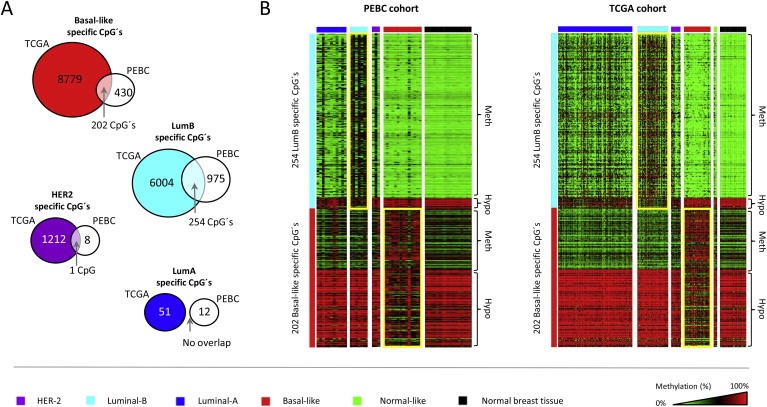
Figure 2.

Validation of CpG methylation patterns associated with breast cancer subtypes. A) The subtype‐specific CpG methylation changes identified in relation to each of the four breast cancer subtypes (LumA, LumB, HER2 and Basal‐like) were validated in an independent cohort obtained through the Cancer Genome Atlas. The overlap, i.e. the number of CpG's consistently associated with each of the subtypes in both the TCGA and PEBC cohorts, is indicated by an arrow. B) The validated set of 254 LumB and 202 Basal‐like specific CpG's shown in both cohorts, i.e. the PEBC cohort (left) and the TCGA cohort (right). The expression‐based subtypes are shown on top of the heat‐maps according to the color scheme displayed at the bottom of the figure. Note the heterogeneity among LumB breast tumors, i.e. although most LumB tumors appear to robustly display the LumB‐methylation pattern there are still those that do not and, furthermore, some of the tumors classified as either LumA or HER2 by expression analysis appear to display the LumB‐associated CpG methylation pattern. The CpG methylation states identified as methylated or hypomethylated (relative to normal breast tissue samples) are indicated on the right hand side of the heat‐maps. The heat‐map colors reflect beta‐values representing the degree of methylation from low to high as green to red, respectively (wherein black represents heterogenous/hemi‐methylation), as shown on the scale at the bottom‐right hand side of the figure.
