Figure 3.

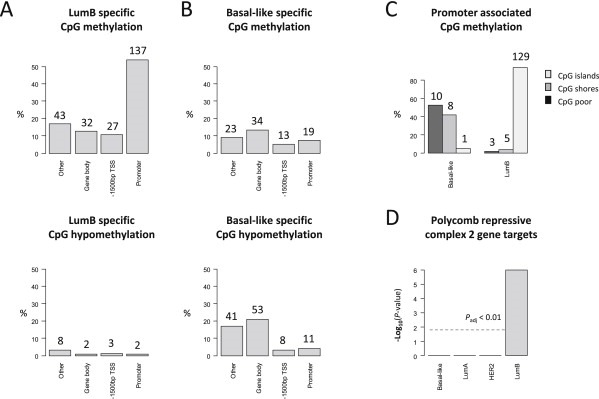
CpG sequence characteristics of the identified subtype‐specific methylation changes. A) The validated DNA methylation signatures specific for LumB (254 CpG's) and B) Basal‐like (202 CpG's) breast cancers differ significantly with respect to the sequence context in which CpG methylation changes tend to occur. The P‐values corresponding to a chi‐squared contingency tests indicate “hallmark” features statistically significant for each of the two subtypes involving promoter methylation events for the LumB subtype (χ 2 = 14.7; P‐value = 0.002) and gene body hypomethylation for the Basal‐like subtype (χ 2 = 9.8; P‐value = 0.02). The percentages are computed over all subtype‐specific CpG's wherein the total number was 254 CpG's for the LumB subtype and 202 CpG's for the Basal‐like subtype (with the number of CpG's given for each count; on the top of each bar). The categories analyzed include 1) gene promoter regions, 2) ‐1500 bp TSS indicative of CpG sites located between 1500 bp and 200 bp upstream of transcription start sites (TSS); thus representing potential cis regulatory regions without involving the promoter region and 3) the gene body sites representing sequences located within the gene body. Lastly, the “other” category predominantly represents CpG's found in intergenic regions, i.e. those found outside of the cis regulatory regions (i.e. those not included in the categories of either promoter or ‐1500 bp CpG's) while also not included in the gene body category. C) Promoters displaying methylation in association with either the Basal‐like or LumB subtypes analyzed in terms of CpG islands, CpG shores or CpG poor promoter regions. The percentages are computed for each subtype separately (i.e. Basal‐like and LumB) based on the total number of promoter methylation events specific for each of the two subtypes, i.e. a total of 19 CpG's for the Basal‐like subtype and 137 CpG's for the LumB subtype. D) The genes affected by promoter methylation within the validated subtype‐specific signatures analyzed in terms of whether or not they have been identified as targets of the Polycomb group repressor complex 2 (PRC2). The P‐values were derived from Fisher's exact hypothesis testing and the threshold line indicated (grey line) reflects the P adjusted < 0.01 significance level after Bonferroni adjustment for multiple hypothesis testing.
