
Figure 1.
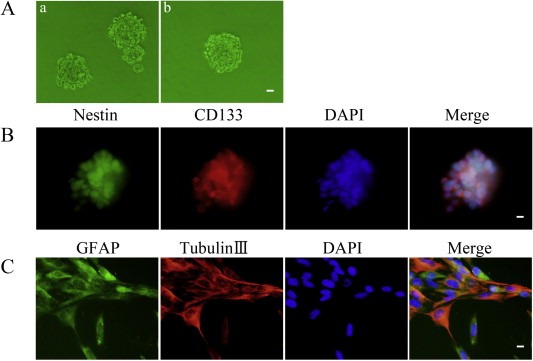
Isolation and identification of GSCs. (A) a: Cells formed spheres in serum‐free medium. b: a single cell formed spheres again by a second round sphere‐forming assay. (B) Cell spheres stained for Nestin (green) and CD133 (red) by immunofluorescence analysis. (C) Cell spheres were differentiated and then stained for GFAP (green) and beta‐tubulin III (red) by immunofluorescence analysis. Nuclei (blue) were labeled with DAPI. Images are representative of independent experiments (n = 5). Scale bars represent 20 μm.