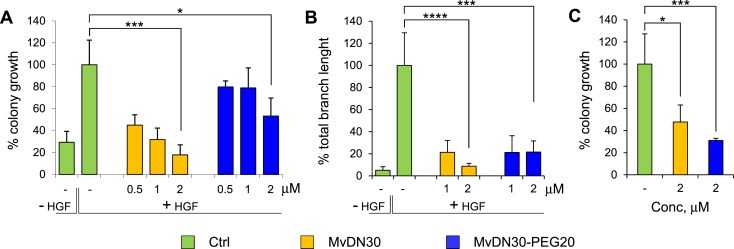
Figure 4.

MvDN30 and MvDN30‐PEG20 inhibit HGF‐dependent Met biological responses in vitro. (A) Anchorage‐independent growth of HGF‐stimulated A549 cells treated with increasing concentrations of MvDN30 or MvDN30‐PEG20. Graph represents the percentage of the average colony growth for each treatment with respect to HGF‐treated cells. (B) Branching morphogenesis of HGF‐stimulated A549 cells treated with two different concentrations of MvDN30 or MvDN30‐PEG20. Graph represents the percentage of the average branch length for each treatment with respect to HGF‐treated cells. (C) Anchorage‐independent growth of U87‐MG cells (characterized by the presence of the HGF/Met autocrine loop) treated with MvDN30 or MvDN30‐PEG20. Graph represents the percentage of the average colony growth for each treatment with respect to untreated cells. *, Student's t Test p < 0.05; ***, Student's t Test p < 0.001; **** Student's t Test p < 0.0001. Each point is the mean of at least triplicate values, bars: standard deviation. Data reported in the figure are representative of at least two experiments done.
