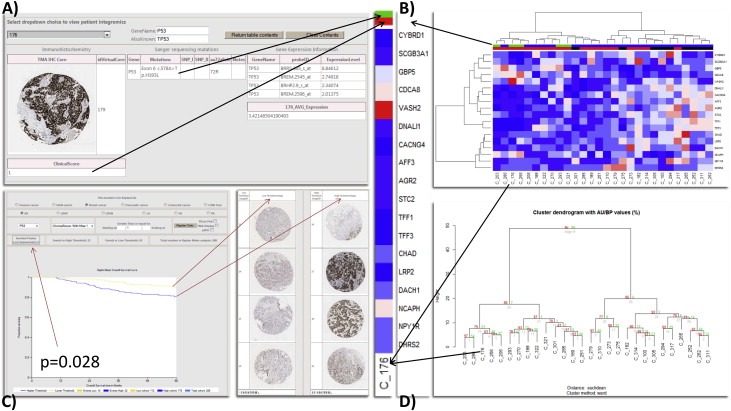
Figure 4.

A) We use the patient integromics analysis to reveal candidates with specific mutations of interest. B) In line with the seminal Miller et al. paper in 2005, we examined the 18/20 identifiable genes from their signature in our microarrays that survived a median filter, using the probe with the highest variance of each gene (if more than one) to examine the integrated information clustered in our data. Top column bar P53 mutation: Green – Mt; Blue – Wt; second column bar IHC: Red – Aberrant extreme (by Boyle et al.); Black – non‐extreme (intermediate patterns in IHC). C) The clinical significance of this data is obtained demonstrating a significant prognostic IHC threshold for aberrant extreme p53, which can be visualised by the thresholded de‐arrayed cores. D) Pvclust bootstrap resampling for the estimation of uncertainty in the data evaluated in B. with bootstrap n = 1000.
