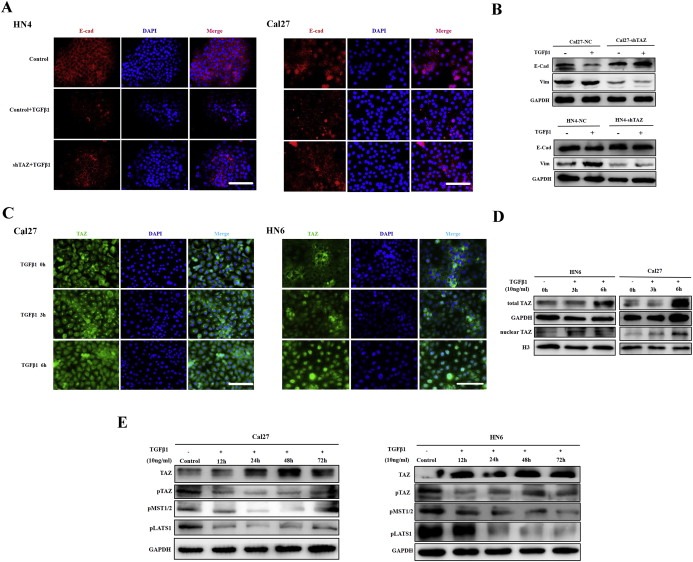
Figure 4.

TAZ is required for TGF‐β1‐induced EMT A: Immunofluorescence staining of E‐cadherin in cells with stable TAZ silencing or control cells following treatment with rhTGF‐β1 (10μ/ml) for 48 h. Scale bar:100 μm. B: The protein abundances of E‐cadherin and Vimentin were determined by western blot after Cal27‐shTAZ and HN4‐shTAZ cells were treated with rhTGF‐β1 (10μ/ml) for 48 h, respectively. Representative images of WB are shown. C: rhTGF‐β1 treatment induced TAZ nuclear translocation in confluent Cal27 and HN6 cells as visualized by immunofluorescence staining during a 6‐h time course. D: rhTGF‐β1 exposure resulted in increased total and nuclear TAZ as gauged by western blot using total protein samples or nuclear fractions. Representative images are shown. E: TGF‐β1 induced total TAZ upregulation and dephosphorylation (TAZ‐Ser89) by inhibiting and inactivating Hippo kinases as measured by MST1/2 (MST‐Thr183/Mst2‐Thr180) and LATS1 (Lats1‐Thr1079) phosphorylation. Representative images are shown. Data shown here are from three independent experiments.
