
Figure 5.
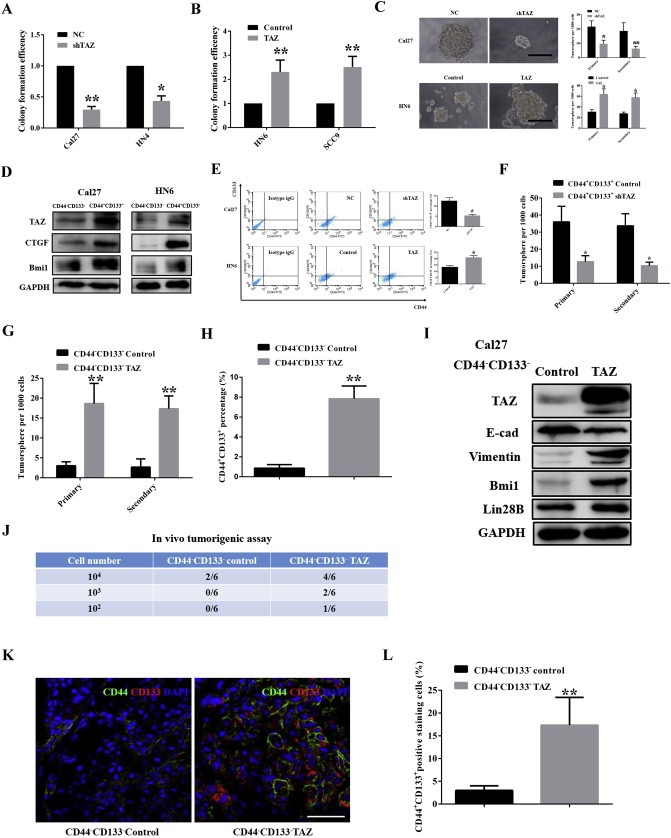
TAZ is essential for oral CSCs maintenance and endows non‐CSCs with some CSCs‐like traits A, B: TAZ knockdown resulted in reduced colony formation efficiencies, while TAZ overexpression significantly enhanced clonal formation in vitro. Colony formation efficiency was defined as the ratios of the numbers of colony generated from indicated cells, while the colony formation in controls was designed as 1. C: TAZ depletion led to fewer and smaller tumorspheres, whereas its overexpression resulted in more and larger tumorspheres. Scale bar:50 μm. D: TAZ, CTGF and Bmi1 were enriched in CD44+CD133+(oral CSC subpopulation) cells. E: The percentages of CD44+CD133+ subpopulation were increased upon TAZ overexpression, while reduced following TAZ knockdown as measured by FACS. F: Tumorsphere formation was impaired when freshly isolated CD44+CD133+ Cal27 cells infected with shTAZ lentivirus. G: Enhanced tumorsphere formation was evident in these freshly isolated CD44−CD133− Cal27 cells infected with TAZ cDNA lentivirus. H: The percentage of CD44+CD133+ subpopulation was significantly increased following TAZ overexpression in freshly sorted CD44−CD133− Cal27 cells (72 h). I: The abundances of TAZ, EMT markers (E‐cadherin, vimentin) and CSCs makers (Bmi1, Lin28B) were probed in CD44−CD133− Cal27 cells infected TAZ cDNA lentivirus (72 h) using western blot. J: The tumor‐initiating potentials of freshly sorted CD44−CD133−Cal27 cells following TAZ cDNA or control lentivirus infection were evaluated by in vivo tumorigenic assay. K, L: CD44CD133 double positive cells in tumor xenograft from CD44−CD133− Cal27 control and CD44−CD133− Cal27 with TAZ enforced overexpression were identified by immunofluorescence staining and quantified. Scale bar: 50 μm. Representative images are shown. Data shown here are mean ± SD from two or three independent experiments, *p < 0.05, **p < 0.01, Student's t‐test.