
Figure 7.
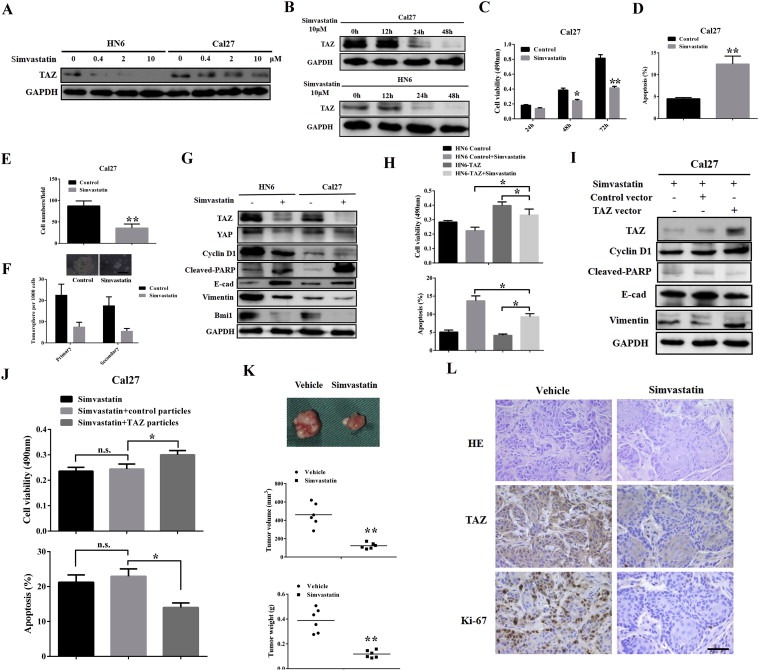
Pharmacological inhibition of TAZ by simvastatin induced anti‐cancer effects and inhibited tumor growth in vivo A,B: Simvastatin induced TAZ inhibition in a dose‐ (chemical treatment for 48 h) and time‐dependent manner in HN6 and Cal27 cells. C–F: Simvastatin treatment resulted in impaired cell proliferation (C), cell apoptosis (D), reduced migration (E) and tumorsphere (F) in Cal27 cells. Scale bar:50 μm. G: The protein abundances of TAZ, YAP, cleaved‐PARP, E‐cadherin, Vimentin and Bmi1 were assayed by western blot following simvastatin exposure. H: TAZ‐overexpressing cells were more resistant to simvastatin challenge as gauged by cell viability (upper panel) and apoptosis assays (lower panel). I–J: TAZ overexpression was able to attenuate the effects induced by simvastatin in Cal27 cells as measured by markers expression and cell viability/apoptosis assays. K: Simvastatin treatment by oral gavage inhibited tumor growth in a xenograft animal model. Upper panel: representative images of tumor masses from animals received simvastatin or vehicle treatment. Middle and lower panel: final tumor volume and weight. L: Representative images of H&E staining and TAZ, Ki‐67 immunohistochemical staining in tumor xenograft samples. Scale bar: 50 μm. Data shown here are mean ± SD from three independent experiments, *p < 0.05, **p < 0.01, ANOVA analyses and Student's t‐test.