
Figure 1.
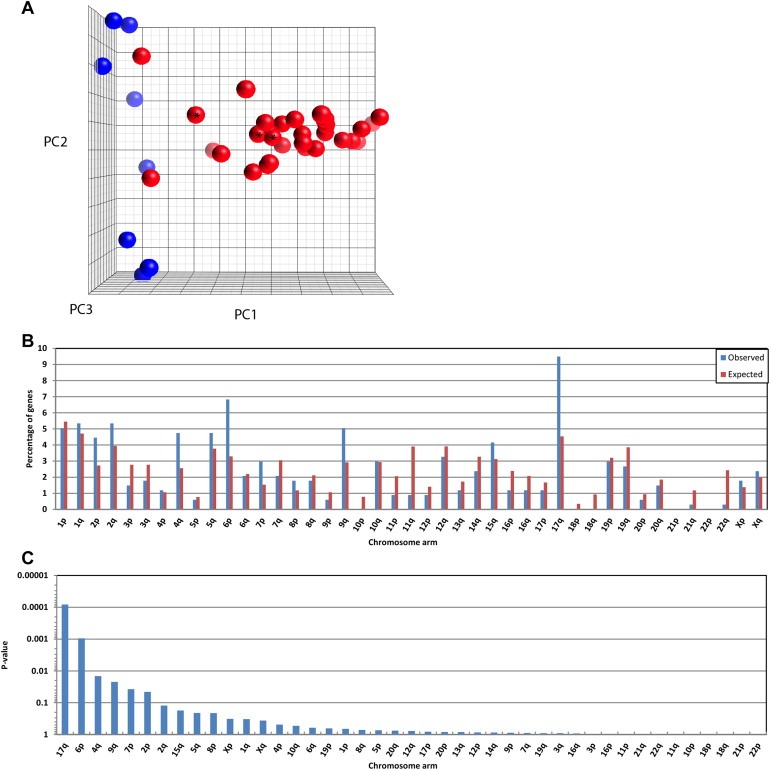
Three‐dimensional principal components plot based expression of the 1000 gene probes with highest variance across eight neurofibromas (blue spheres) and 30 MPNST samples (red) (A). *Samples with RIN values between 3 and 5. Percentagewise distribution over 43 chromosome arms of Entrez annotated gene probes on the AB1700 microarray (N = 11,596 genes) (expected distribution; red bars) compared to the distribution of the significantly upregulated genes (N = 337) in MPNST vs neurofibroma (observed distribution; blue bars) (B). Statistical significance of the deviation between observed and expected distribution of the N = 337 upregulated genes in MPNST vs neurofibroma as sorted by the P‐value from a binomial distribution test, cumulative probability, P (X ≥ x) (C).