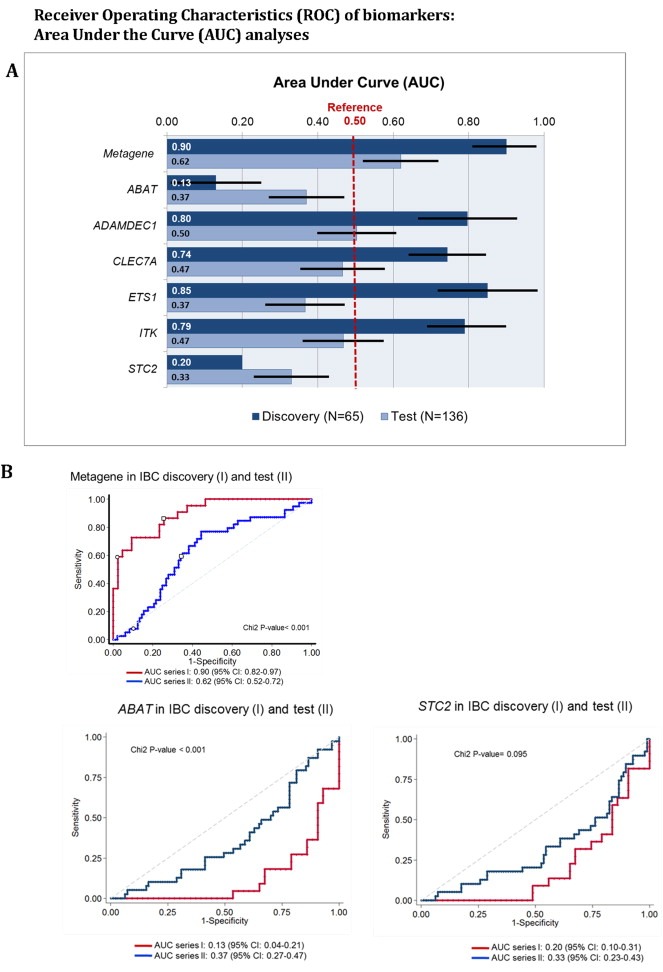
Figure 2.

Receiver Operator Characteristics (ROC) Analyses. The ROC‐analyses generate Area Under Curve (AUC) values presented in Figure 2A as measure for the discriminatory potential of the individual genes to predict IBCs and nIBCs correctly within the test (series II) compared to the discovery (series I). Factors with AUC (or their intervals) value 0.5 are not informative. The results show as illustrated with ROC plots in Figure 2B that AUCs for only the metagene, ABAT and STC2 are discriminatory and comparable for the discovery and test.
