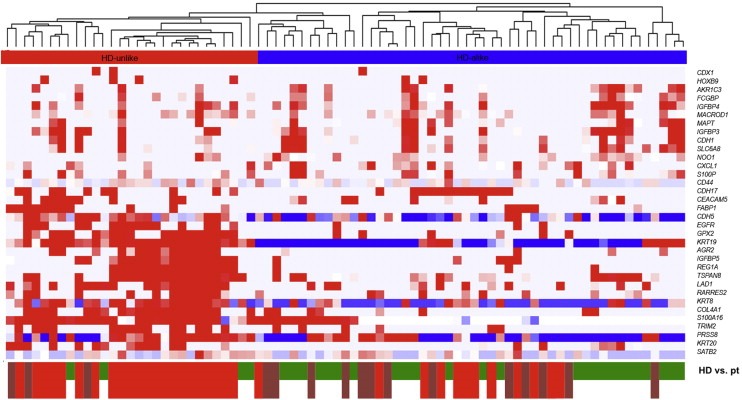
Figure 4.

Clustering of patients from the primary and secondary sets without enumerated CTCs with healthy donors (HDs). Unsupervised hierarchical clustering analysis comparing mRNA gene expression profiles in mCRC CTC‐enriched fractions from 49 patients without detectable CTCs and QC mRNA available (33 from the primary set and 16 from the independent second set) and 30 HDs. Data shown have been subjected to median normalization of each individual sample across all genes followed by median normalization of each individual gene across all samples. Columns represent patient samples, rows represent genes. Red color indicates a transcript level above the median level, white color indicates a median transcript level, and blue color indicates a transcript level below the median level of the particular mRNA in all samples. Depicted gene clusters were identified at an average linkage correlation greater than 0.2. At the top, the HD‐unlike patient cluster is indicated in red; the HD‐alike patient cluster in blue. Healthy donors (HD, green), primary patients (pt, bright red) and secondary patients (dark red) are depicted on the bottom of the graph.
