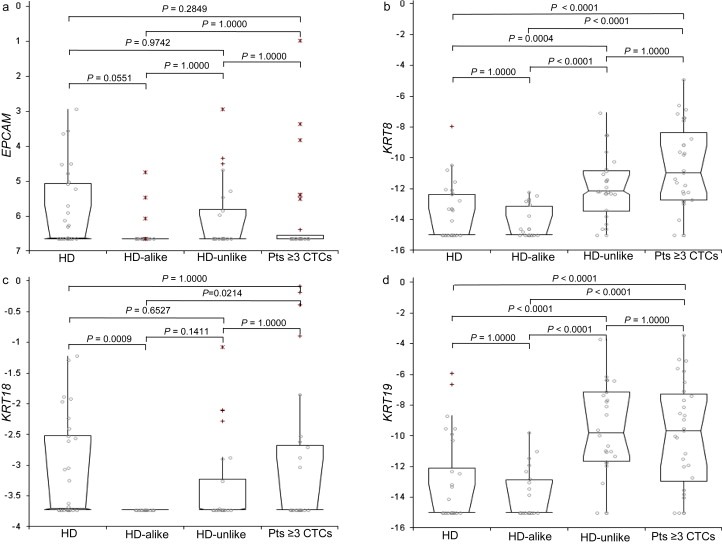
Figure 5.

Expression of CTC‐markers in CellSearch‐enriched blood from 30 HDs and 49 patients without detectable CTCs compared with patients with three or more CTCs. Expression levels of EPCAM, KRT8, KRT18 and KRT19 are depicted for 30 HDs, 23 HD‐alike, 26 HD‐unlike and 30 patients with three or more CTCs from the whole patient set. Expression levels were measured in RNA isolated from the EpCAM‐enriched (CellSearch) blood fractions and are depicted as deltaCt to the median of the reference genes (GUSB, HMBS and HPRT1). Box plots represent median, 95% confidence interval (box) and outlier (+; >1.5 and <3 interquartile range,*; >3 interquartile range) expression levels. Level of significance tested with Kruskal–Wallis test followed by post‐hoc contrast analysis. HD, healthy donor; pts, patients.
