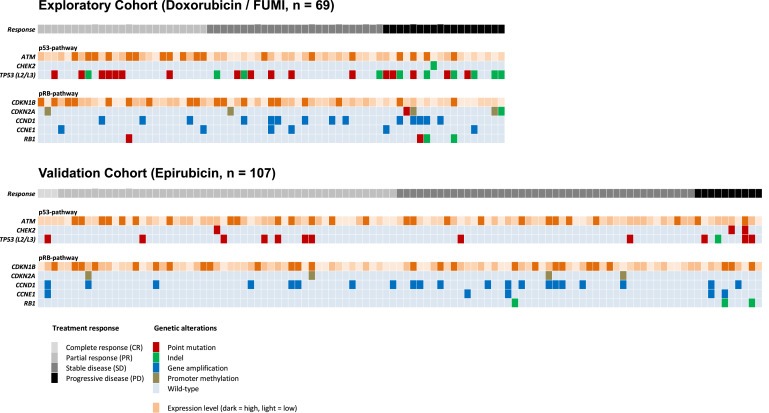
Figure 3.

Graphical summary of the detected genetic alterations. Each column represent one of the 176 patients analyzed (Exploratory Cohort; n = 69 and Validation Cohort; n = 107) while each row represent one of the analyzed genes in the p53‐or the pRB‐pathway. Treatment response and genetic alterations for each individual patient is given as colored squares according to the color‐key (bottom panel). A detailed summary of these findings are listed in Supplementary Tables S3A and S3B.
