Figure 4.

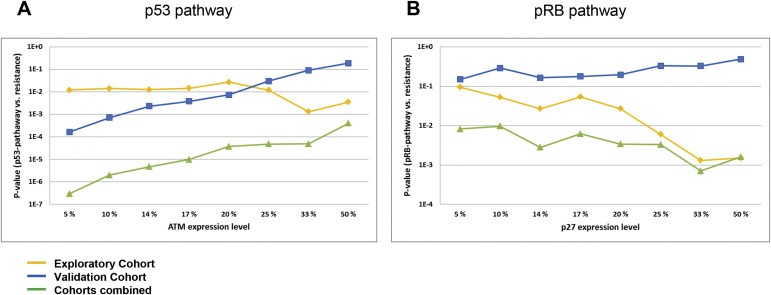
Correlations between p53‐/or pRB‐pathway defects and resistance to DNA damaging drugs. (A) Lines representing p‐values (Y‐axis) for the correlations between defects in the p53‐pathway (TP53 mutations, CHEK2 mutation or low levels of ATM mRNA) and resistance to DNA damaging drugs in vivo, plotted as a function of different cut‐offs applied to define “pathologically” low levels of ATM (X‐axis). The percentages refer to the lower percentile of patients in each cohort. (B) Lines representing p‐values (Y‐axis) for the correlations between defects in the pRb pathway (RB1 mutations, Cyclin D or E amplifications, CDKN2A defects or low levels of p27 mRNA) and resistance to DNA damaging drugs in vivo, plotted as a function of different cut‐offs applied to define “pathologically” low levels of p27 (X‐axis). Exploratory cohort (Cohort 1; treated with doxorubicin or 5‐FU/mitomycin; yellow line), validation cohort (Cohort 2; treated with epirubicin; blue line) and combined data from cohort 1 and 2 (green line).
