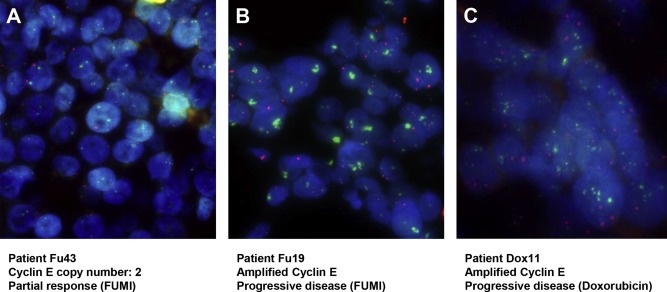
Figure 5.

Cyclin E copy number analysis. Representative pictures of Cyclin E copy number analyses as performed by fluorescence in situ hybridization (FISH) using Cyclin E specific probe (green) and centromere 11 specific probe (red). (A) Normal copy number. (B) Highly amplified Cyclin E locus in patient with progressive disease upon 5‐FU and mitomycin treatment. (C) Highly amplified Cyclin E locus in patient with progressive disease upon doxorubicin monotherapy treatment. Magnification 630×.
