
Figure 2.
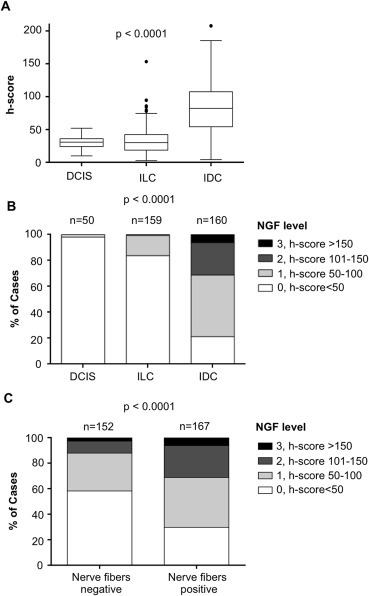
Frequency distribution of NGF level in breast cancers according to the presence of nerve fibers. NGF levels were obtained after digital quantification. A) Distribution of NGF intensity staining (h‐score) in ductal carcinomas in situ (DCIS), invasive lobular carcinomas (ILC) and invasive ductal carcinomas (IDC). Box and Whisker plots comparing median NGF levels using h‐scores as a measure of IHC staining (n = 50, 160 and 160, respectively). The box limits indicate the 25th and 75th percentiles with the whiskers extending 1.5 times the interquartile range from the 25th and 75th percentiles (outliers are represented by dots; prepared using BoxPlotR). B) Distribution of NGF staining intensity in DCIS, ILC and IDC. Categorization is presented as 0 = h‐score <50, 1 = h‐score 50–100, 2 = h‐score 101–150, 2 = h‐score>150. C) Distribution of NGF staining intensity in invasive tumors (nerve fibers positive versus nerve fibers negative tumors). Categories of NGF staining (0, 1, 2, 3) were the same as in B. Tumors presenting with nerve fibers were more likely to have higher NGF expression than tumors without nerve fibers. Number of cases (n) is indicated. ***One‐way ANOVA was used for A and Chi square for B and D.