
Figure 5.
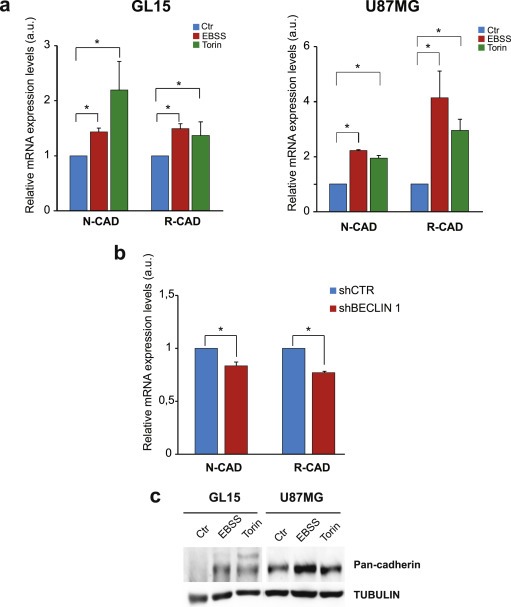
Cadherin expression upon autophagy modulation. (a) mRNA expression levels of N‐CADHERIN (N‐CAD) and R‐CADHERIN (R‐CAD) obtained by real‐time PCR on GL15 (left graph) and U87MG (right panel) cultured in DMEM, EBSS and 250 nM Torin 1‐containing medium, as indicated in the graph legend. The graphs represent the mean ± SE of three different experiments. Statistical significance: *P < 0.05; one‐way ANOVA. (b) mRNA expression levels of N‐CAD and R‐CAD obtained by real‐time PCR on GL15 cells after retroviral infection with scramble RNA (shCtr) or BECN‐1‐directed RNA (shBECLIN) grown in control conditions. Statistical significance: *P < 0.05; one‐way ANOVA. (c) Protein extracts from GL15 and U87MG cells grown in DMEM (Ctr), in EBSS and in Torin 1 (Torin) were subjected to Western blotting analysis of cadherins by using anti‐Pan‐Cadherin antibody. TUBULIN was used as loading control.