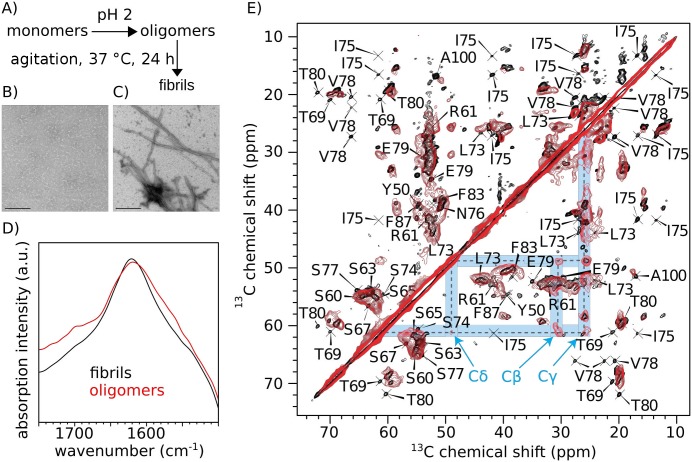
Fig 3. Comparison of MAK33 VL oligomers and fibrils.
A) Procedure to form oligomers and fibrils. B), C) Electron micrographs of MAK33 VL S20N oligomers (B) and fibrils (C). The scale bar denotes 200 nm. D) FTIR spectra of MAK33 VL S20N oligomers and fibrils. The peak maxima were 1619 cm-1 (oligomers) and 1621 cm-1 (fibrils), respectively. The oligomer spectrum displayed an additional peak at 1697 cm-1. E) PDSD 13C,13C-intraresidue correlations of MAK33 VL S20N fibrils and MAK33 VL WT oligomers. The proline spin system, which is more intense in the oligomers, is highlighted in blue.

