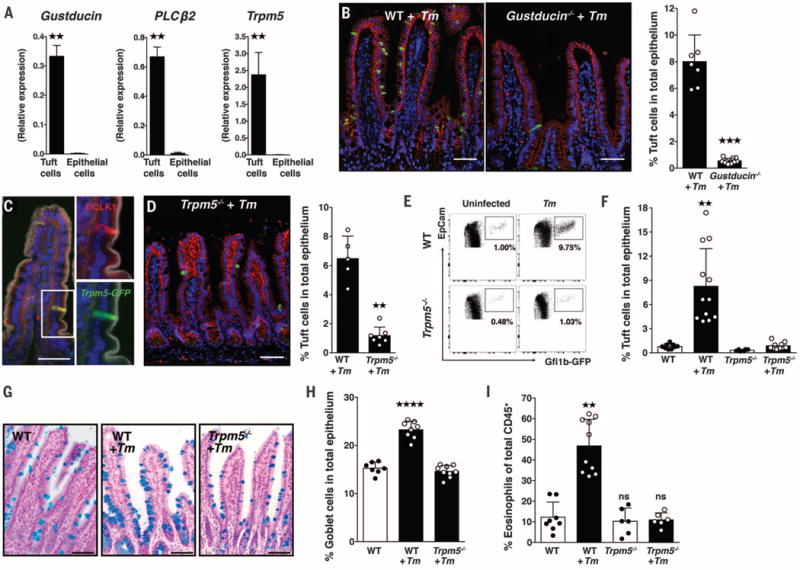
Fig. 2. Tuft cells influence type 2 immunity through TRPM5.

(A) Gustducin, PLCβ2, and TRPM5 expression in sorted tuft cells, compared with the non-tuft cell epithelium. (B) Representative images of Tm-colonized WT and gustducin−/− mice and tuft cell frequencies. (C) Representative image from Trpm5eGFP mice. GFP is shown in green), DCLK1 in red), DAPI in blue, and phalloidin in white. (D) Representative image of Tm-colonized Trpm5−/− mice and tuft cell frequencies. Scale bars in (B), (C), and (D), 50 μm. (E) Representative flow cytometry plots of IECs from uninfected (left) or Tm-colonized (right) WT (Gfi1beGFP/+, top) and Trpm5−/− (Gfi1beGFP/+ Trpm5−/−, bottom) mice and (F) tuft cell frequency. (G) Goblet cells in SI sections stained with Alcian blue and nuclear red in uninfected WT and Tm-colonized WT and Trpm5−/− mice and (H) goblet cell frequency. (I) Eosinophil frequency in the distal SI lamina propria (LP) of uninfected and Tm-colonized WT and Trpm5−/− mice. Scale bars, 50 μm. Each symbol represents an individual mouse, and all data are representative of at least three independent experiments. Data are plotted as means with SD. Four stars, P < 0.0001; three stars, P = 0.0001; two stars, P < 0.01; ns, not significant; one-way ANOVA, Kruskal-Wallis, or Mann-Whitney tests.
