
Figure 1. Altered microglial gene profile and immaturity in GF animals.
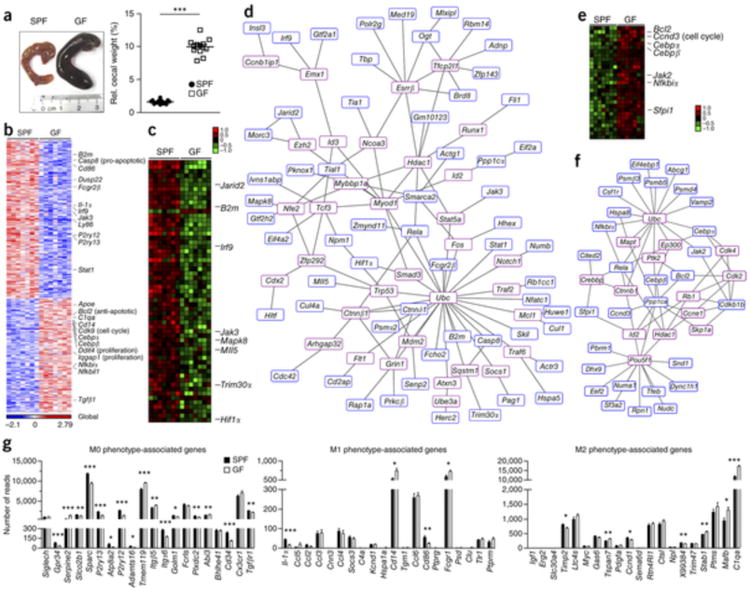
(a) Left, photograph of caeca from SPF (control) and GF mice. Representative pictures are shown, with ruler for scaling. Right, relative cecal weight (to body weight) of SPF and GF mice. Symbols represent individual mice. 12 mice per group were examined. Data are representative of three independent experiments. Data are presented as mean ± s.e.m. Significant differences were determined by an unpaired t test, ***P = 0.0001. (b) RNA-seq analysis. Gene expression data shown was either induced or reduced by a factor of at least 2 (P < 0.01, unpaired t test) in microglia from SPF or GF mice. Representative genes are noted on the right. Each column represents microglia data from one individual mouse, with seven mice per group. Color code presents linear scale. (c) mRNA expression profile of genes that were at least 1.5-fold (P < 0.05, unpaired t test) downregulated in microglia from GF compared to SFP mice. Color code shows linear values. Representative genes are noted on the right. (d) Functional networks of genes that were downregulated (at least 1.5-fold, P < 0.05, unpaired t test) in microglia from GF compared to SPF mice. Blue framed genes were found to be downregulated whereas red framed genes were automatically predicted. (e) Expression profile of genes that were at least 1.5-fold (P < 0.05, unpaired t test) upregulated in microglia from GF compared with SFP mice. Representative genes are noted on the right. Color code presents linear scale. (f) Functional networks of upregulated genes (at least 1.5-fold, P < 0.05, unpaired t test). Blue-framed genes indicate upregulated molecules whereas red-framed genes were automatically predicted. (g) mRNA expression values (number of reads) of genes from microglia in GF (white bars) or SPF (black bars) mice were categorized according to the M0, M1 or M2 phenotypes, as described previously32. Bars represent means ± s.e.m. with seven samples per group. Significant differences were determined by an unpaired t test (*P < 0.05, **P < 0.01, ***P < 0.001). P values: Gpr34, 0.0005; Serpine2, <0.0001; Slco2b1, 0.0078; Sparc, <0.0001; P2ry13, 0.0001; Atp8a2, 0.0239; P2ry12, <0.0001; Adamts16, 0.0105; Tmem119, 0.0002; Itgb5, 0.0052; Itga6, 0.0003; Golm1, 0.0125; Plxdc2, 0.006; Abi3, 0.0037; Cd34, 0.0001; Tgfbr1, 0.0035; Il-1α, 0.0002; Cd14, 0.0109; Cd86, 0.004; Fcgr1, 0.0281; Timp2, 0.0144; Tspan7, 0.0074; Ccnd1, 0.0378; X99384, 0.0077; Stab1, 0.0093; Mafb, 0.0257; C1qa, 0.0001.