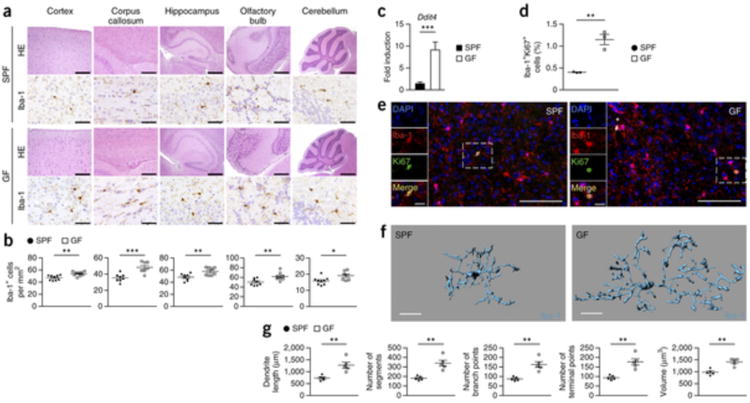
Figure 3. Lack of microbes impairs microglia morphology and disturbs cellular network.

(a) CNS histology of several brain regions that were stained with hematoxylin and eosin (H&E) or subjected to immunohistochemistry for Iba-1 to detect microglia. Scale bars represent 200 μm (H&E, cortex and corpus callosum), 500 μm (H&E, hippocampus and olfactory bulb), 1 mm (H&E, cerebellum) and 50 μm (Iba-1). Representative pictures from nine mice per group are displayed. (b) Number of Iba-1+ ramified parenchymal microglia in different localizations of the CNS. Each symbol represents data from one mouse, with nine mice per group. Three to four sections per mouse were examined. Data are presented as mean ± s.e.m. Data are representative of two independent experiments. Significant differences were determined by an unpaired t test (*P < 0.05, **P < 0.01, ***P < 0.001). P values: cortex, 0.0024; corpus callosum, 0.0008; hippocampus, 0.0073; olfactory bulb, 0.0092; cerebellum, 0.0246. (c) Expression of Ddit4 mRNA measured by qRT-PCR in microglia isolated from SPF (black bar) or GF (white bar) mice. Data are presented as mean ± s.e.m. with five samples in each group. Significant differences were determined by an unpaired t test (***P = 0.0002). Data are representative of two independent experiments. (d) Quantification of proliferating Iba-1+ Ki67+ double-positive parenchymal microglia was performed on cortical brain slices. Each symbol represents one mouse, with three mice per group. Three to four sections per mouse were examined. Data are presented as mean ± s.e.m. Significant differences were determined by an unpaired t test (**P = 0.0033). (e) Fluorescence microscopy of Iba-1+ (red) microglia, the proliferation marker Ki67 (green) and DAPI (4′,6-diamidino-2-phenylindole, blue). Overview and magnification are shown. Scale bars represent 100 μm (overview) and 20 μm (inset). (f,g) Three-dimensional reconstruction (scale bars represent 15 μm, f) and Imaris-based automatic quantification of cell morphometry (g) of cortical Iba-1+ microglia. Each symbol represents one mouse with at least three measured cells per mouse. Five mice per group were analyzed. Data are presented as mean ± s.e.m. Significant differences were determined by an unpaired t test (**P < 0.01). P values: dendrite length, 0.0035; number of segments, 0.0012; number of branch points, 0.0012; number of terminal points, 0.0012; volume, 0.0011.
